Figures & data
Table 1. Central composite design used for optimization of LVC-loaded CCPCs.
Table 2. The atomic composition of the molecular dynamics simulated LVC-loaded CCPCs.
Table 3. Experimental runs, independent variables, and measured responses of LVC-loaded CCPCs.
Table 4. Output data of the central composite design and predicted and observed values for the optimum CCPCs.
Figure 1. Effect of formulation variables on EE% of LVC-CCPCs (A-B) and PS (C-D).
Abbreviation: EE%: Entrapment efficiency percentage, PS: Particle size, LVC: levocetirizine hydrochloride and CCPCs; cationic ceramide/phospholipid composite.
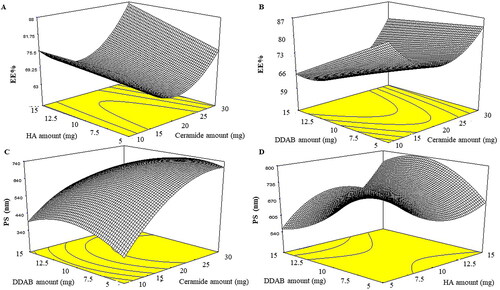
Figure 2. Effect of formulation variables on ZP of LVC-CCPCs (E-F) and desirability figure(G).
Abbreviation: ZP: zeta potential; LVC: levocetirizine hydrochloride and CCPCs; cationic ceramide/phospholipid composite.
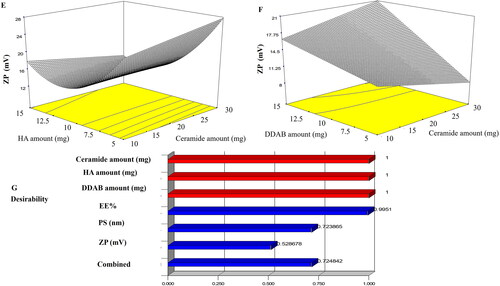
Table 5. Stability study of the optimum CCPCs.
Figure 3. Transmission electron micrographs of LVC-loaded CCPCs.
Abbreviation: LVC: levocetirizine hydrochloride and CCPCs; cationic ceramide/phospholipid composite.
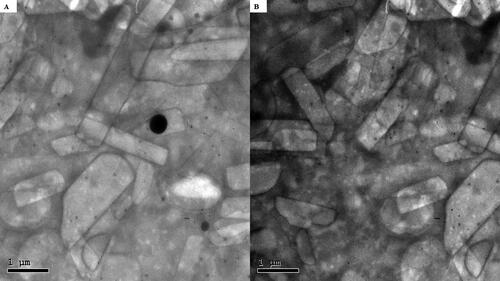
Figure 4. Predicted docking pose of LVC-PC binding complex. Stick 3 D-representation of LVC (yellow) loaded on PC interface (green), in presence of several CCPCs additives; ceramide (cyan), DDAB (blue), Phytanriol (orange), and HA (magenta). All introduced formulation additives served as either direct or indirect connecting/supportive platforms for favored anchoring of LVC within the drugphospholipid complex. Polar interactions (hydrogen bond) are represented as black dashed lines.
Abbreviation: HA: hyaluronic acid; DDAB: dimethyldidodecylammonium bromide; PC: phospholipid; LVC: levocetirizine hydrochloride and CCPCs; cationic ceramide/phospholipid composite.
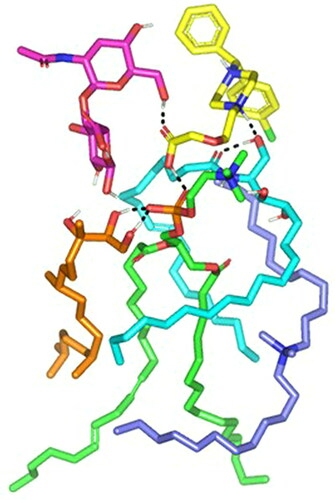
Figure 5. Time evolution conformational alterations of LVC-PC-CCPCs additive heterocomplex throughout an explicit MD simulation run at a 100% aqueous solvation system. The thermodynamic movements and stability of formulation components; LVC (yellow) loaded on PC interface (green), in presence of several CCPCs; Ceramide (cyan), DDAB (blue), Phytantriol (orange), and HA (magenta), were monitored over MD simulation trajectories being captured at different snapshots ① 0.2 ns, ② 0.4 ns; ③ 0.6 ns; ④ 0.8 ns; and ⑤ 1 ns. Polar interactions (hydrogen bond) are represented as black dashed lines.
Abbreviation: HA: hyaluronic acid; DDAB: dimethyldidodecylammonium bromide; PC: phospholipid; LVC: levocetirizine hydrochloride and CCPCs; cationic ceramide/phospholipid composite; MD: molecular dynamic simulation.
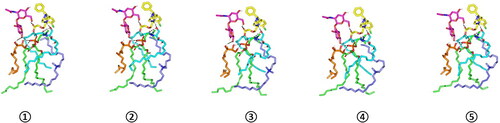
Figure 6. Overlay of LVC-PC-CCPCs additive heterocomplex across MD simulation frames (left panel) and molecular surface 3 D-representation of the inverted cone micellar configuration at 100% aqueous solvation system (right panel). Molecular surface and sticks 3 D representations were illustrated in colors being previously assigned for the optimized formulation components; yellow, green, cyan, blue, orange, and magenta for LVC, PC, Ceramide, DDAB, Phytantriol, and HA, respectively.
Abbreviation: HA: hyaluronic acid; DDAB: dimethyldidodecylammonium bromide; PC: phospholipid; LVC: levocetirizine hydrochloride and CCPCs; cationic ceramide/phospholipid composite; MD: molecular dynamic simulation.
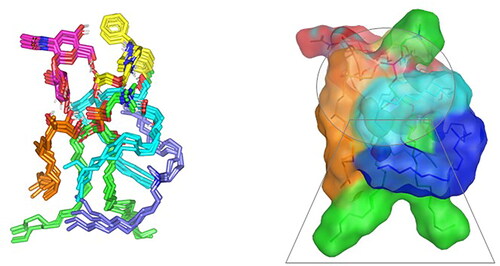
Figure 7. Ex-vivo permeation profile of LVC from CCPCs, compared to its aqueous solution.
Abbreviation: LVC: levocetirizine hydrochloride and CCPCs; cationic ceramide/phospholipid composite.
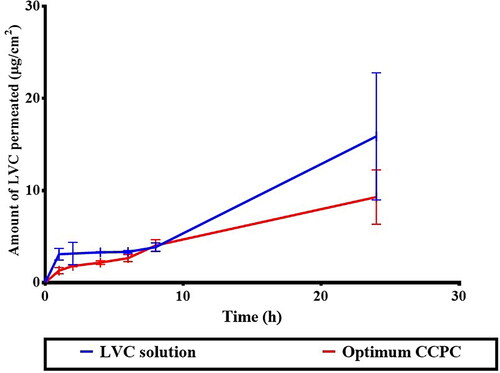
Table 6. Permeation of LVC solution compared to the optimum CCPCs and permeation parameters.
Figure 8. In-vivo skin deposition profile of LVC from CCPCs, compared to its aqueous solution.
Abbreviation: LVC: levocetirizine hydrochloride, and CCPCs; cationic ceramide/phospholipid composite.
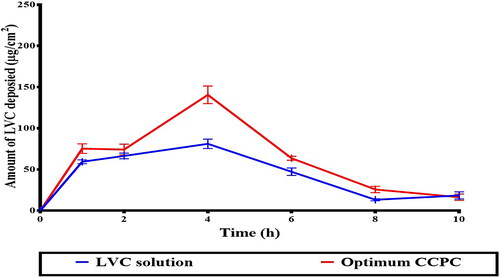
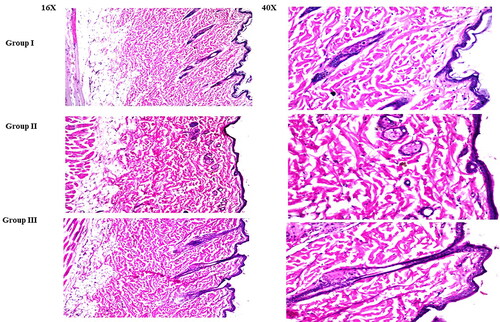
Figure 9. Light microscope photomicrographs showing histopathological sections (hematoxylin and eosin-stained) of rat skin in normal control (group I), rat skin treated with LVC solution (group II), and rat skin treated with optimum CCPCs (group III) with a magnification power of 16X to illustrate all skin layers (Left side) and magnification power of 40X to identify the epidermis and dermis (Right side).
Abbreviation: LVC: levocetirizine hydrochloride, and CCPCs; cationic ceramide/phospholipid composite.