Figures & data
Figure 1. GUL-PEG-SS-OA was synthesized by conjugating PEG, OA with GUL. The formation of PEG-SS-OA was determined by using hydrogen-1 nuclear magnetic resonance (1H NMR) analysis (1–8 in the 1H NMR are marked one by one on the structure of GUL-PEG-SS-OA).
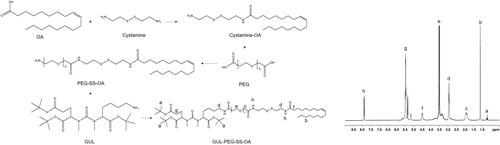
Figure 2. TEM image of GUL-SS DTX/EZL-NPs (A); In vitro drug release of DTX (B) and EZL (C) from GUL-SS DTX/EZL-NPs were evaluated in phosphate buffer solution (PBS) with or without GSH (10 mM) by a dialysis method. Results are presented as means ± SD. *p < .05.
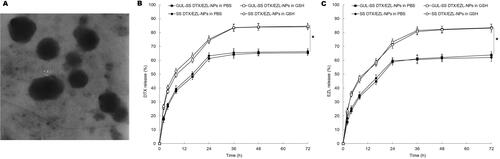
Table 1. The particle size, PDI, zeta potential, DL, and EE of NPs.
Figure 3. The cellular uptake efficiency of C6-loaded NPs. *p < .05.
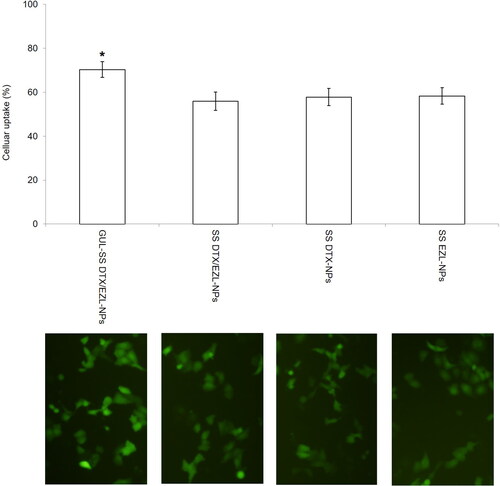
Figure 4. The cytotoxicity of NPs was determined by MTT assay. Results are presented as means ± SD. *p < .05.
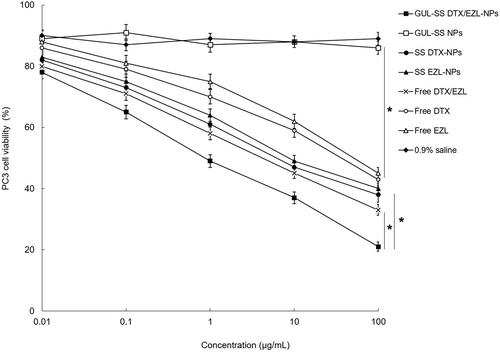
Figure 5. In vivo tissue distribution of DTX after 1 h (A) and 48 h (B) of administration; tissue distribution of EZL after 1 h (C) and 48 h (D) of administration. Results are presented as means ± SD. *p < .05.
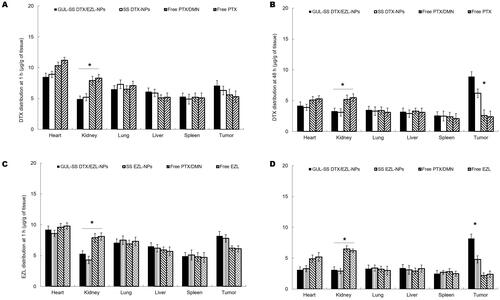
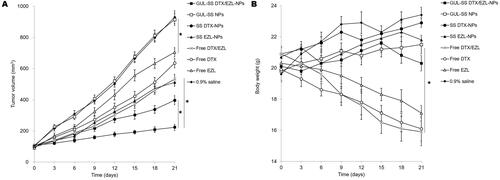
Figure 6. In vivo tumor inhibition effect (A) and body weight changes (B). Results are presented as means ± SD. *p < .05.