Figures & data
Figure 1. Characterization of naringenin nanoparticles (NGNPs). Hydrodynamic size distributions of (A) BSANPs and (B) NGNPs. (C) Zeta potential of BSANPs and NGNPs. (D) TEM images of BSANPs and NGNPs. (E) FTIR spectra and (F) XRD spectra of naringenin, BSANPs and NGNPs.
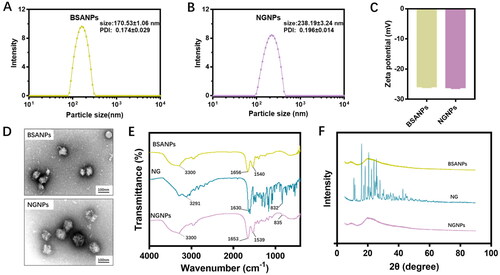
Figure 2. The stability, in vitro release profiles, and solubilizing effect of NGNPs. (A) The change of particle size of NGNPs in PBS buffer containing 5%, 10% and 50% FBS. (B) The change of particle size of NGNPs during 36 h storage. (C) The cumulative release of naringenin from naringenin solution and NGNPs. (D) The photos of naringenin or equivalent NGNPs in pH 7.4 PBS after centrifugation. (E) Relative solubility of naringenin in the collected supernatant.
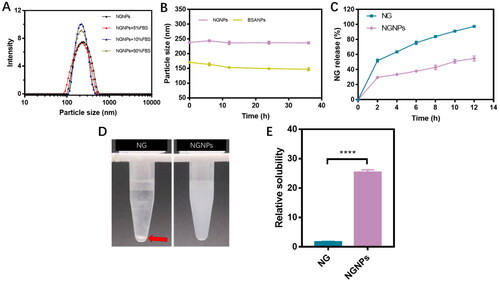
Figure 3. In vitro hemolysis test and biocompatibility of NGNPs. (A) Hemolysis test of NGNPs (a: purified water; b: 0.9% NaCl solution; c: 10 μg/mL NGNPs; d: 20 μg/mL NGNPs; e: 50 μg/mL NGNPs; f: 100 μg/mL NGNPs). (B) Hemolysis ratio of NGNPs. The in vitro biocompatibility of NGNPs were tested in (C) AML12 cells, (D) HepG2 cells, (E) 3T3 cells and (F) HUVEC cells.
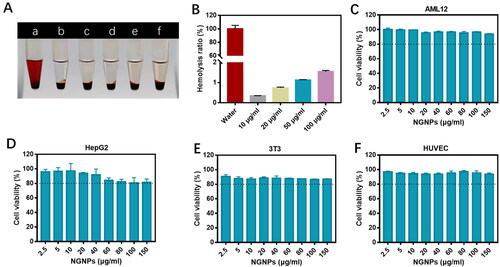
Figure 4. In vitro antioxidant effects of NGNPs. (A) Intracellular ROS levels of H2O2-Stimulated AML12 cells after treatment with NG and NGNPs was observed by fluorescent microscopy. (B) Semi-quantitative results of fluorescence intensity of ROS. (C) Cell viability of H2O2-stimulated AML12 cells after treatment with NG and NGNPs. The level of (D) LDH, (E) MDA and (F) SOD in H2O2-stimulated AML12 cells after treatment with NG and NGNPs. Scale bar = 100 μm. Data are presented as means ± SEM. n.s., no statistical significance. *P < 0.05, **P < 0.01, ***P < 0.001, ****P < 0.0001.
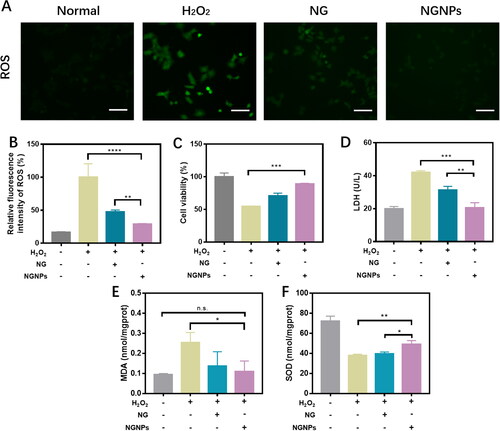
Figure 5. In vitro anti-inflammatory effects of NGNPs. RAW264.7 cells were stimulated with LPS (3 μg/mL) for 6 h and the fluorescence images of (A) TNF-α and (B) IL-6 in each group were obtained. Scale bar = 50 μm. Fluorescence semi-quantitative statistics of (C) TNF-α and (D) IL-6 in RAW264.7 cells of each group. The secreted amount of (E) TNF-α and (F) IL-6. **P < 0.01, ***P < 0.001, ****P < 0.0001.
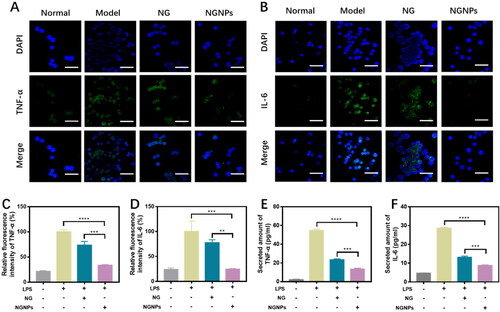
Figure 6. In vivo biodistribution of NGNPs. (A) In vivo whole-body fluorescence images at different time points and ex vivo images of major organs of mice intravenous injected with DiR solution or DiR-NGNPs. Semi-quantitative statistical plot of (B) fluorescence in vivo abdomen and (C) fluorescence of major organs. ***P < 0.001.
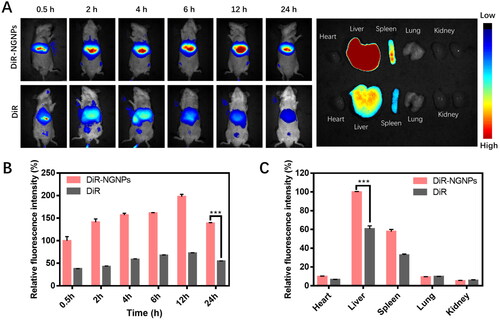
Figure 7. In vivo therapeutic effect of NGNPs in ALI mouse model. (A) Experimental scheme diagram. (B) Two-dimensional ultrasonic images of Normal, Model, NG and NGNPs group. (C) Representative images of liver and the H&E staining images of liver tissue in each group (black dashed line and red arrow indicate the necrotic liver tissue). Scale bar = 100 μm. (D) The liver volume, (E) liver venous flow velocity, (F) liver index, (G) liver wet-dry ratio and (H) injury score of each group. The level of (I) AKP, (J) AST and (K) ALT in serum of each group. *P < 0.05, **P < 0.01, ***P < 0.001, ****P < 0.0001.
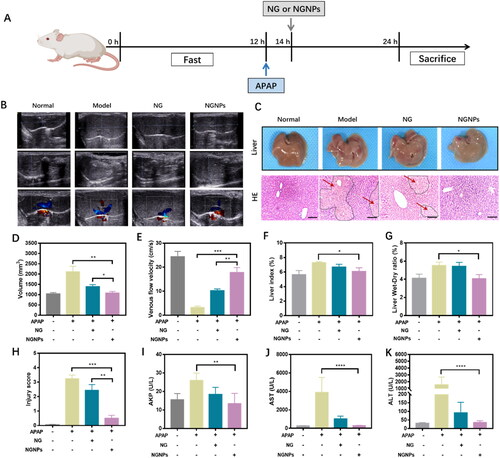
Figure 8. Anti-inflammatory, anti-apoptotic and anti-oxidative effects of NGNPs in vivo. (A) The Bax, Bcl-2, IL-6 and IL-1β immunohistochemical staining of liver tissue in each group mice. The (B) Bax, (C) Bcl-2 positive field portion in each group mice. (D) The TUNEL fluorescence staining and (E) corresponding semi-quantitative statistics of Tunel levels. The positive field portion of (F) IL-6 and (G) IL-1β in liver tissue of mice in each group. The levels of (H) SOD, (I) MDA and (J) LDH of liver in each group mice. Scale bar = 100 μm. *P < 0.05, **P < 0.01, ***P < 0.001, ****P < 0.0001.
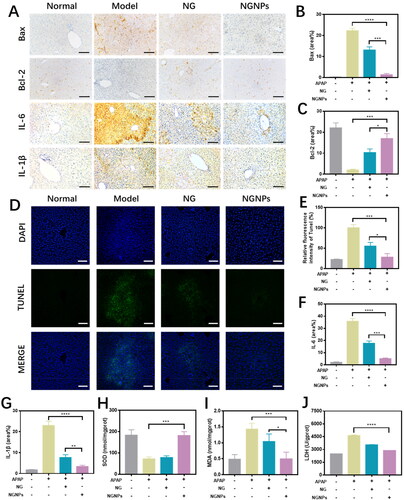
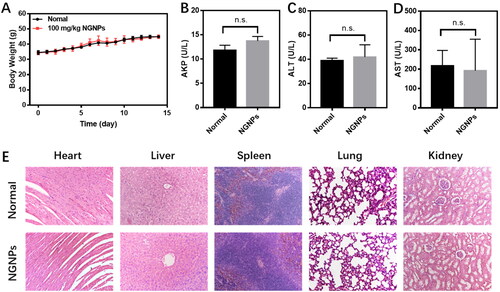
Figure 9. In vivo safety assessment of NGNPs. (A) Weight change in normal mice and mice injected with high dose NGNPs for 14 days. The level of (B) AKP, (C) ALT and (D) AST of in serum of each group. (E) H&E staining of heart, liver, spleen, lung and kidney of mice in each group. n.s., no statistical significance.