
Figures & data
Figure 1. SEM morphology (A), TEM image (B), XRD pattern (C), XPS survey scan spectrum (D), XPS spectra of Fe2p (E), Hysteresis loop (F), FTIR spectra (G), EDS spectrum (H), and BET measurement (I) of magnetic Fe3O4 nanoparticles heated at 170 °C for 24 h with a heating rate of 3 °C/min.
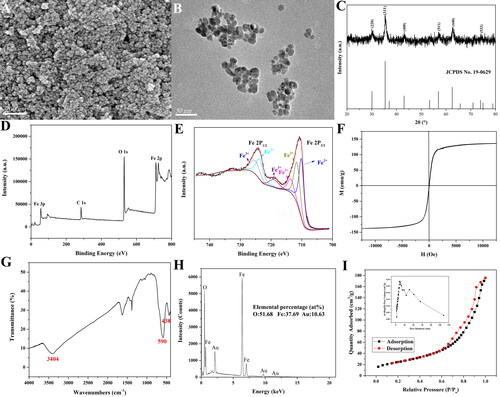
Figure 2. TEM image of Fe3O4 nanoparticles heated at 170 °C for 24 h (A) and Fe3O4@mSiO2 nanoparticles (B), and the FTIR spectra of the process of magnetic Fe3O4 nanoparticles coated with silica (C).
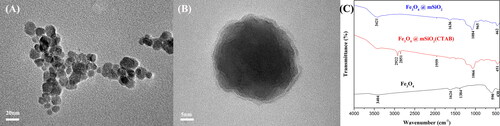
Figure 3. FTIR spectra (A), Hysteresis loop (B), and the change of surface zeta potential (C) of Fe3O4, Fe3O4@mSiO2, Fe3O4@mSiO2-NH2, Fe3O4@mSiO2- NH2-FA; The Nitrogen adsorption-desorption curve (D), and pore size distribution (E) of Fe3O4@mSiO2-NH2-FA.
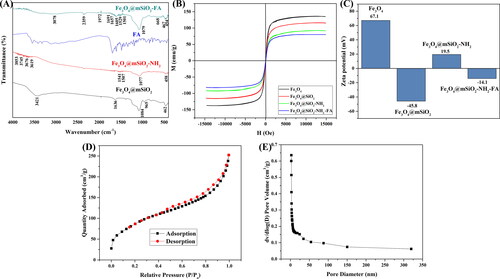
Figure 4. The toxicity of Fe3O4 (A) and Fe3O4@mSiO2-NH2-FA (B) to cells at different time points and the toxicity of Fe3O4@mSiO2-NH2-FA to cells with or without an external magnetic field (C) (n = 3, * P < .05, ** P < .01, compared with the control group, # P < .05, ## P < .01, comparison between groups).
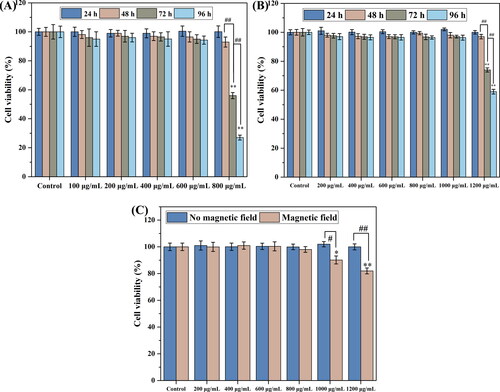
Figure 5. Prussian blue staining of MCF-7 cells: blank group (A, C), 40 μg/mL magnetic Fe3O4@mSiO2-NH2-FA nanocomposites (B, D).
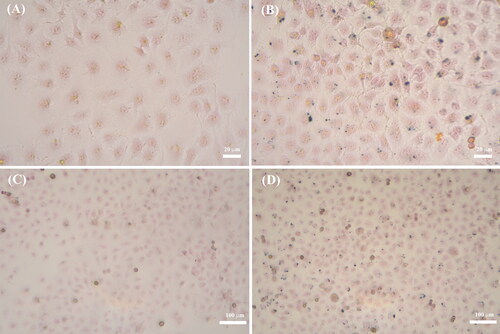
Figure 6. Cytotoxicity of free TAX and magnetic Fe3O4@mSiO2-NH2-FA-TAX nanocomposites (with and without a magnetic field) to MCF-7 cells at 24 h (A), 48 h (B), 72 h (C) (n = 3, ** P < .01, compared with the control group, # P < .05, ## P < .01, comparison between groups).
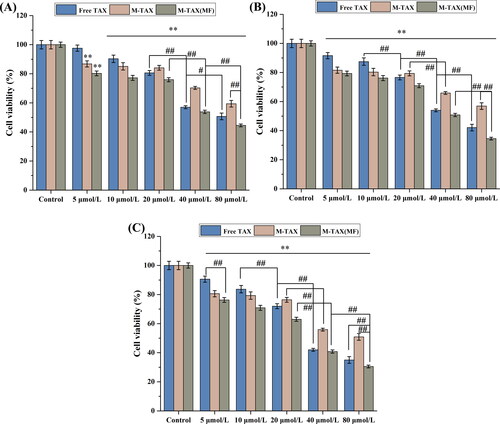
Figure 7. The AO/EB double staining fluorescence images of MCF-7 cells treated with blank control (A), Fe3O4@mSiO2-NH2-FA-TAX nanocomposites without MF (B), free TAX (C), and Fe3O4@mSiO2-NH2-FA-TAX nanocomposites with MF (D) for 24 h.
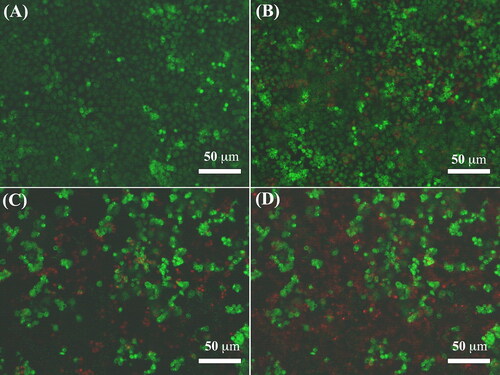
Figure 8. Flow cytometry scatter plots of Annexin V-FITC/PI apoptosis staining: (A) Control, (B) Fe3O4, (C) Fe3O4@mSiO2-NH2-FA, (D) Fe3O4@mSiO2-NH2-FA-TAX, (E) Free TAX, and (F) Fe3O4@mSiO2-NH2-FA-TAX + MF.
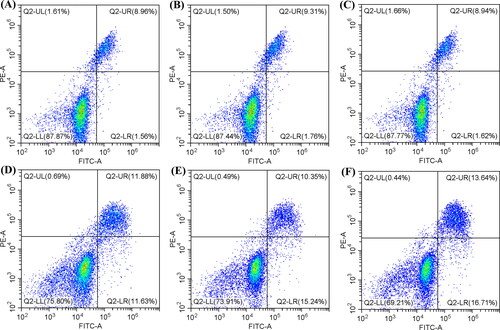
Figure 9. Detection of ROS in MCF-7 cells treated by blank control group (A1), Fe3O4 (A2), Fe3O4@mSiO2-NH2-FA (A3), Fe3O4@mSiO2-NH2-FA-TAX (A4), free TAX (A5), and Fe3O4@mSiO2-NH2-FA-TAX with magnetic field (A6), respectively. Detection of SOD level (B1) and MDA level (B2) in MCF-7 cells treated by blank control group, Fe3O4 (M), Fe3O4@mSiO2-NH2-FA (M-FA), free TAX, Fe3O4@mSiO2-NH2-FA-TAX (M-FA-TAX), and Fe3O4@mSiO2-NH2-FA-TAX with MF, respectively (n = 3, ** P < .01, compared with the control group, ## P < .01, comparison between groups).
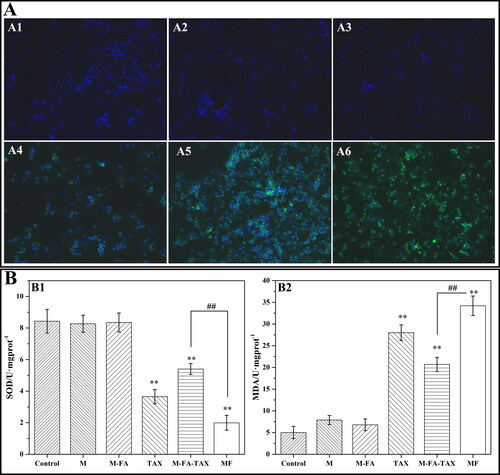
Figure 10. Effects of apoptosis related protein expression levels in MCF-7 cells treated with different groups (A). Where M represents Fe3O4@mSiO2-NH2-FA, M-TAX represents Fe3O4@mSiO2-NH2-FA, and MF represents magnetic field action (n = 3, ** P < .01, compared with the control group, # P < .05, ## P < .01, comparison between groups). Effects of ferroptosis related protein expression levels in MCF-7 cells treated with different groups (B). Where M represents Fe3O4@mSiO2-NH2-FA, M-TAX represents Fe3O4@mSiO2-NH2-FA, MF means magnetic field action (n = 3, ** P < .01, compared with the control group, # P < .05, ## P < .01, comparison between groups).
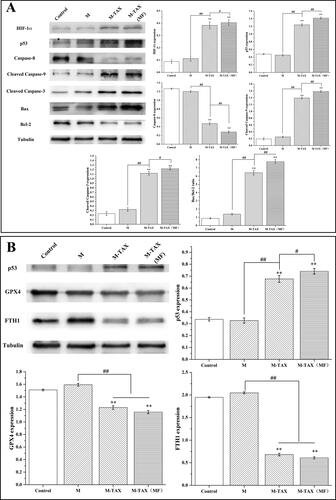
Figure 11. Effect of MCF-7 cell activity treated by Fe3O4@mSiO2-NH2-FA-TAX under the action of magnetic fields with and without NAC treatment (n = 3, ** P < .01, compared with the control group, # P < .05, ## P < .01, comparison between groups).
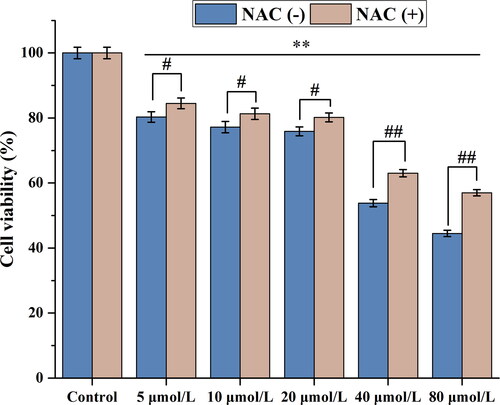
Figure 12. Level of ROS detected by DCFH-DA probe.
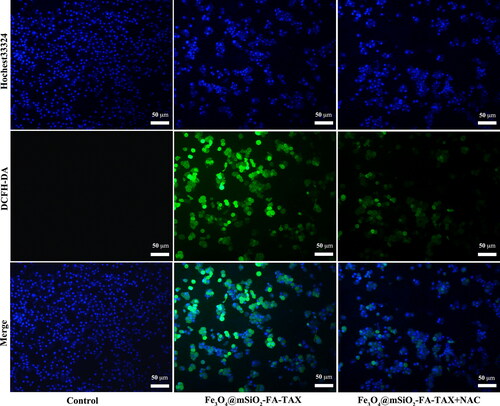
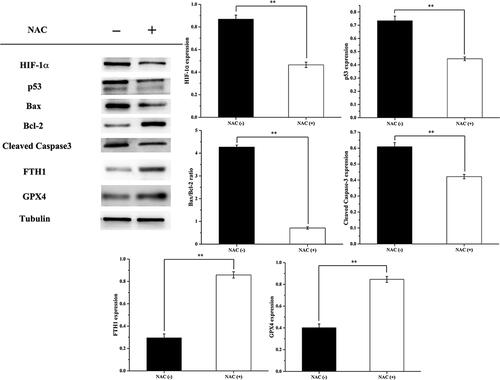
Figure 13. Effects of apoptosis and ferroptosis related protein expression levels in MCF-7 cells treated by Fe3O4@mSiO2-NH2-FA-TAX under the action of magnetic fields with and without NAC treatment. (−) means not treated by NAC, (+) means treated by NAC (n = 3, **P < .01, comparison between groups).
Supplemental Material
Download MS Word (746.4 KB)Data availability statement
The data and materials generated and analyzed during the current study are available from the corresponding author on reasonable request.