Figures & data
Table 1. The uncoded and coded levels of the NLCs formulation factors along with their constraints.
Table 2. Details of samples prepared for the characterization and evaluation of the PV-Pd nanogels.
Figure 1. PV solubility in different lipids (mean ± SD).
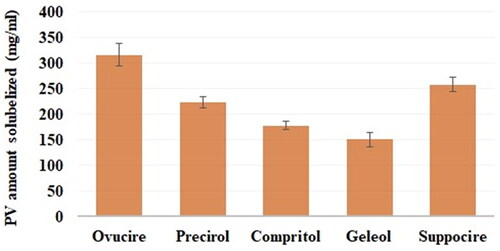
Table 3. Central composite quadratic design and responses of PV-Pd-NLCs.
Figure 2. Perturbation diagram (A), contour plot (B), and 3D response surface plot (C) showing the effect of the studied factors on the particle size.
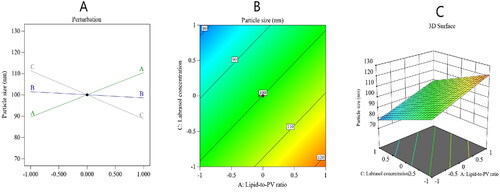
Figure 3. Perturbation diagram (A), contour plot (B), and 3D response surface plot (C) showing the effect of the studied factors on the stability index.
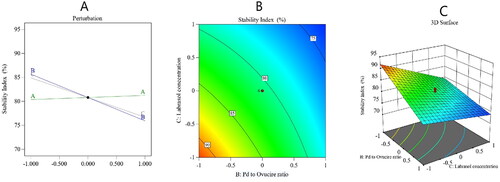
Figure 4. Bar chart and desirability ramp for the optimization process. The desirability ramp shows the levels of study factors and expected values for the dependent variables of the optimized PV-Pd-NLCs (A). The bar chart shows the values of desirability for the conjugated responses (B).
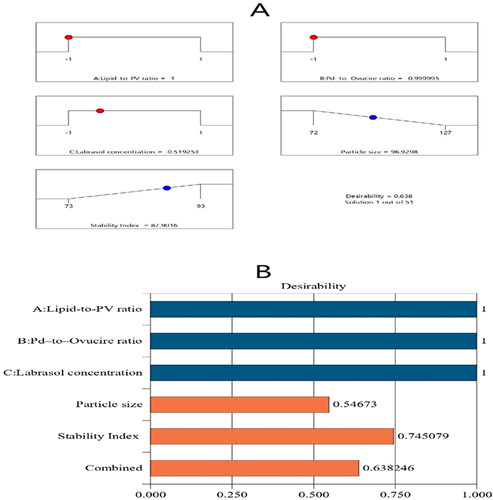
Table 4. Tentative and expected values of the optimized PV-Pd-NLCs.
Table 5. Rheological parameters of plain Carbopol hydrogel and Carbopol hydrogel containing optimized PV-Pd-NLCs.
Figure 5. TEM photomicrograph of the optimal PV-Pd-NLC.
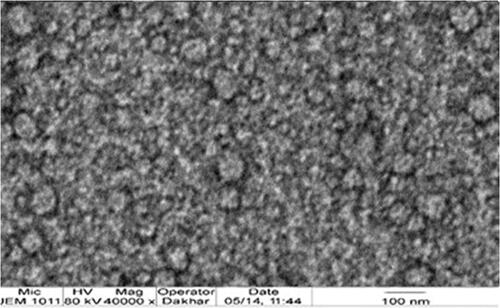
Figure 6. In vitro release profiles of PV from optimal PV-Pd-NLCs and PV suspension (mean ± SD, n = 3).
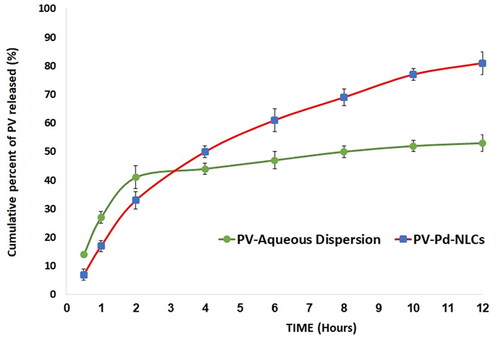
Figure 7. Plots of log shear rate (G) versus log shearing stress (F) for determination of Farrow’s constant (n) of (A) plain gel and (B) gel containing optimal PV-Pd-NLCs.
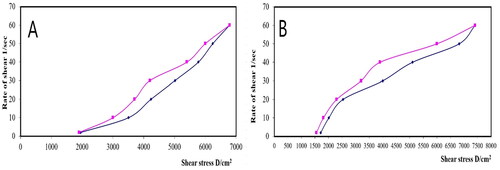
Figure 8. Flow curves of (A) plain gel and (B) gel containing optimal PV-Pd-NLCs.
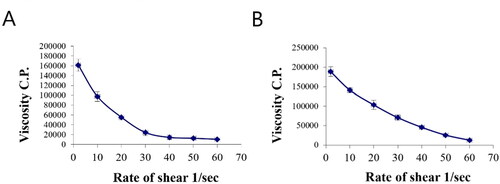
Figure 9. Rheograms of (A) plain gel and (B) gel containing optimal PV-Pd-NLCs. N.B.: The tested formulations were (A) hydrogel containing optimized PV-Pd-NLCs, (B) hydrogel containing NLCs formulated with castor oil instead of Pd oil, (C) hydrogel containing Pd-NLCs formulated without PV, (D) aqueous dispersion PV-Pd-NLCs formulated without Carbopol 940 gelling agent, and (E) Physical mixture of PV and Pd oil.
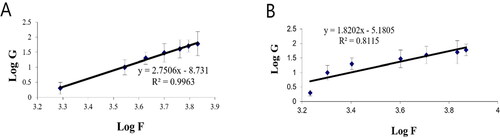
Figure 10. In vitro release profiles of PV from (A) gel containing optimal formulation, (D) aqueous dispersion of optimal formulation and drug aqueous dispersion (means ± SD).
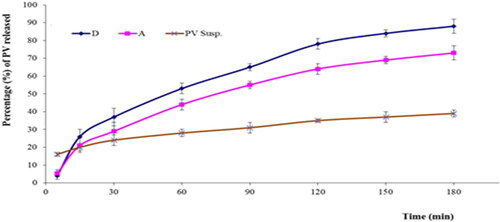
Figure 11. Effect of different PV-containing formulations and the control on the viability of the HGF-1 cell line. The values are the mean ± SD of three independent experiments.
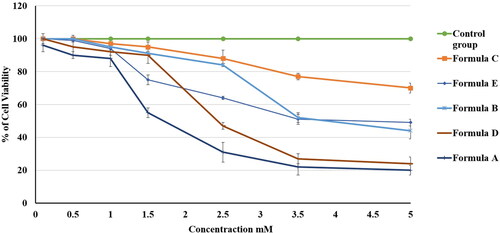
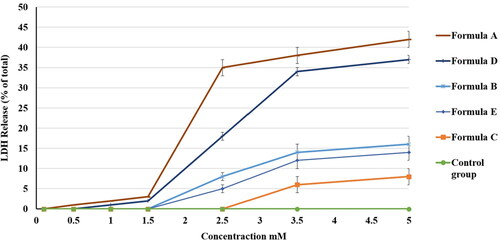
Figure 12. Effect of different PV formulations and the control on the percentage of LDH release from the HGF-1 cell line. The values represent the means ± SD of three independent experiments. N.B.: The tested formulations were (A) hydrogel containing optimized PV-Pd-NLCs, (B) hydrogel containing NLCs formulated with castor oil instead of Pd oil, (C) hydrogel containing Pd-NLCs formulated without PV, (D) aqueous dispersion PV-Pd-NLCs formulated without Carbopol 940 gelling agent, and (E) physical mixture of PV and Pd oil.