Figures & data
Figure 1. Schematic structure of PEG-SS-MX-1-MT/FA and drug effect under the tumor microenvironment.
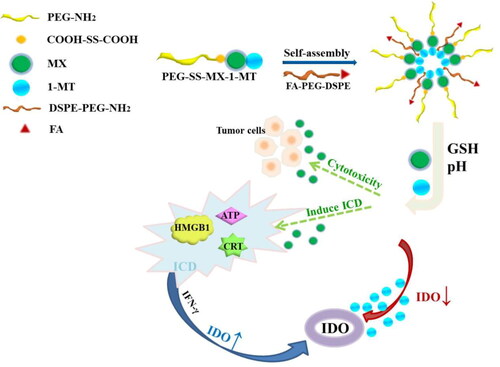
Figure 2. (a) Synthetic route of PEG-SS-MX-1-MT. (b) FT-IR spectra of MX, 1-MT, PEG-SS-COOH and PEG-SS-MX-1-MT. (c) 1H-NMR spectrum of PEG-SS-MX-1-MT.
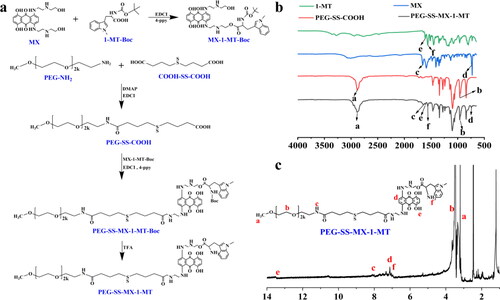
Figure 3. (a) Synthetic route of DSPE-PEG-FA (DSPE-PEG-NH2). (b) 1H-NMR spectrum of DSPE-PEG-FA. (c) FT-IR spectra of DSPE-PEG-NH2, FA and DSPE-PEG-FA.
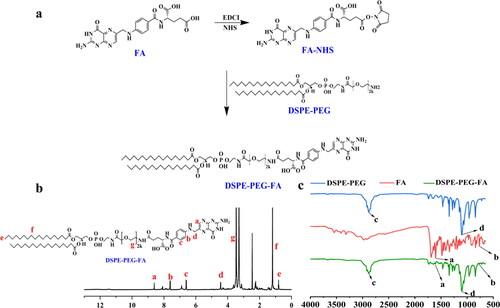
Figure 4. (a) Size of PEG-SS-MX-1-MT/FA. (b) Stability of PEG-SS-MX-1-MT/FA micelles in vitro. (c) Reduction-responsive release of disulfide bonds. (d) Morphology and CMC of PEG-SS-MX-1-MT/FA. (e) Hemolysis of PEG-SS-MX-1-MT/FA. (f) Release of 1-MT in vitro.
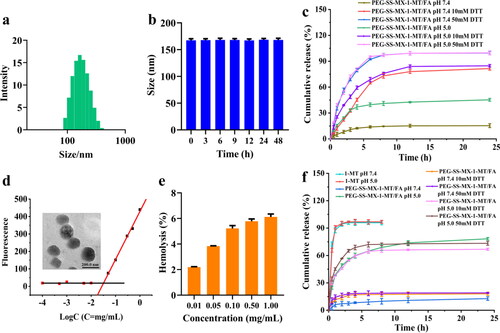
Figure 5. (a) Cell inhibition ratio of MCF-7/ADR cells incubated with different concentrations of MX, MX + 1-MT, PEG-SS-MX-1-MT and PEG-SS-MX-1-MT/FA. (b) Inhibition of proliferation of 3D tumor spheroids. (c) Wound healing assay of MCF-7/ADR cells. (d) Cellular uptake of MCF-7/ADR.
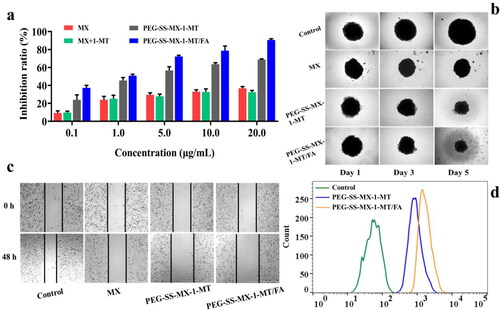
Figure 6. (a) CRT efflux detected by immunofluorescent. (b) HMGB1 secretion detected by ELISA test kit. (c) HMGB1 secretion detected by immunofluorescent. (d) ATP release detected by test kit. (e) IDO inhibition of PEG-SS-MX-1-MT/FA. ***p < 0.0001.
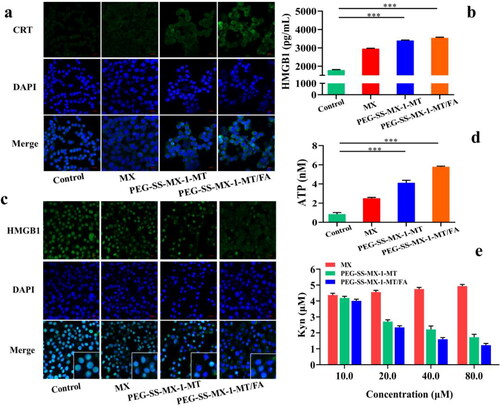
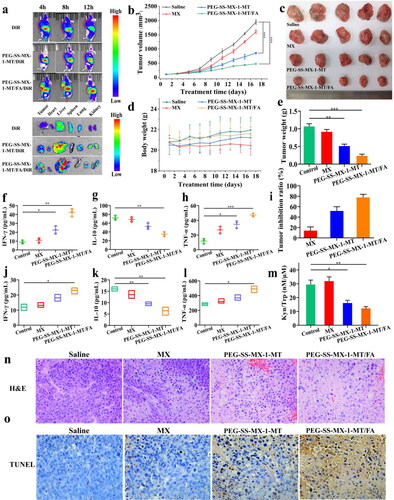
Figure 7. (a) In vivo distribution of DiR, PEG-SS-MX-1-MT/DiR and PEG-SS-MX-1-MT/FA/DiR. (b) Change of tumor volume. (c) Images of excised tumors. (d) Body weight changes of nude mice in each group. (e) Tumor weight. (f) IFN-γ in serum. (g) IL-10 in serum. (h) TNF-α in serum. (i) Tumor inhibition ratio. (j) IFN-γ in tumor. (k) IL-10 in tumor. (l) TNF-α in tumor. (m) In vivo Kyn to Trp ratio. (n) H&E staining of tumor sections. (o) TUNEL staining of tumor sections. (*p < 0.01, **p < 0.001, ***p < 0.0001, scale bar: 50 μm).