
Figures & data
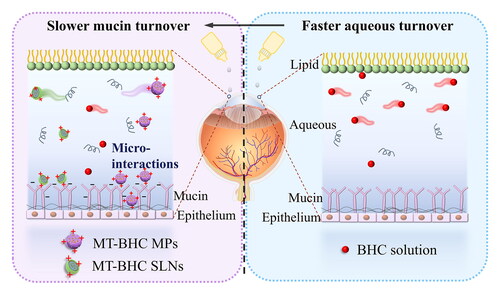
Figure 1. Schematic diagram of the preparation processes of MT-BHC MPs and MT-BHC SLNs.
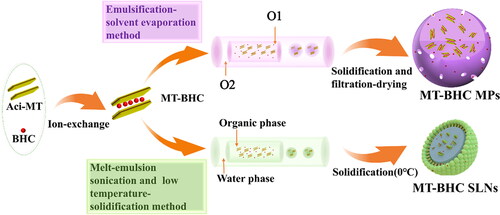
Figure 2. Characterization of MT-BHC MPs and MT-BHC SLNs. A: SEM images of MT-BHC MPs (top) and MT-BHC SLNs (bottom); B: Cumulative drug release from MT-BHC MPs, MT-BHC SLNs, and BHC solution (mean ± SD, n = 3).
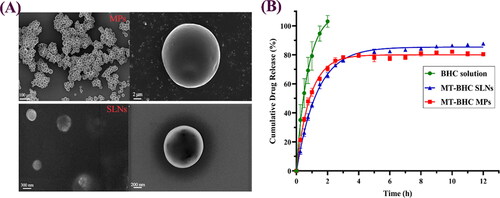
Table 1. Physicochemical characteristics of MT-BHC MPs and MT-BHC SLNs (data expressed as mean ± SD, n = 3).
Figure 3. In vivo fluorescent tracing and physicochemical properties of BHC solution, MT-BHC SLNs, and MT-BHC MPs. A: Precorneal retention of the BHC solution, MT-BHC SLNs, and MT-BHC MPs eye drops using the fluorescence tracing method. No fluorescence was found after application of the BHC solution after 16 min, the MT-BHC SLNs after 45 min, and the MT-BHC MPs after 135 min. B: Surface tension and contact angle of the BHC solution, MT-BHC SLNs, and MT-BHC MPs eye drops. C: The spreading time of BHC solution, MT-BHC SLNs, and MT-BHC MPs eye drops on isolated rabbit cornea.
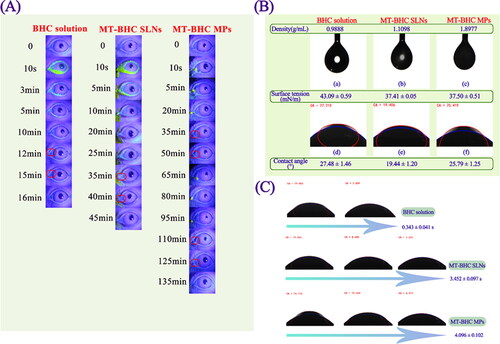
Table 2. Rheological behavior of MT-BHC SLNs and MT-BHC MPs eye drops (mean values ± SD, n = 3).
Table 3. Scatchard-plot equation and Rose Bengal binding constant values (K) for MT-BHC MPs and MT-BHC SLNs.
Figure 4. Tear elimination pharmacokinetics and schematic diagram of transformation for tear film turnover pattern based micro-interactions. A: Tear drug concentration-time curves after topical application of 100 μL BHC solution, MT-BHC MPs, and MT-BHC SLNs eye drops to rabbit eyes (mean ± SD, n = 3). B: Schematic representation of the proposed micro-interactions of the BHC solution, MT-BHC MPs, and MT-BHC SLNs with the ocular surface after topical administration. (1) In the early stage, some free drug molecules from the BHC solution, large MT-BHC MPs and small MT-BHC SLNs remain on the ocular surface. (2) Positively charged MT-BHC MPs, and MT-BHC SLNs interact with negatively charged tear film mucins suggesting that particles are no longer eliminated by aqueous flow. (3) After penetrating the mucin layer, MT-BHC MPs with higher hydrophobicity interacted with the corneal epithelium to maintain longer retention.
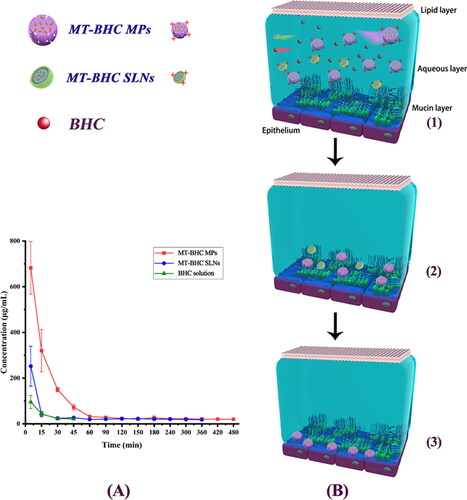
Table 4. Date analysis of the tear elimination pharmacokinetics results.
Figure 5. A: Rabbit chronic high intraocular pressure model. B: IOP-lowering effects of BHC solution, MT-BHC MPs and MT-BHC SLNs eye drops after topical administration (mean ± SD, n = 3).
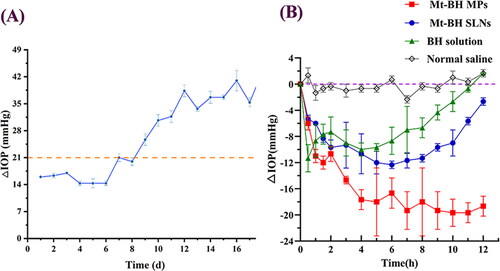
Table 5. Date analysis of the IOP-lowering effects.
Table 6. Ocular irritation scores in rabbits (single and multiple administration, n = 3).
Figure 6. Corneal and scleral tissue sections after repeated eye drop administration.
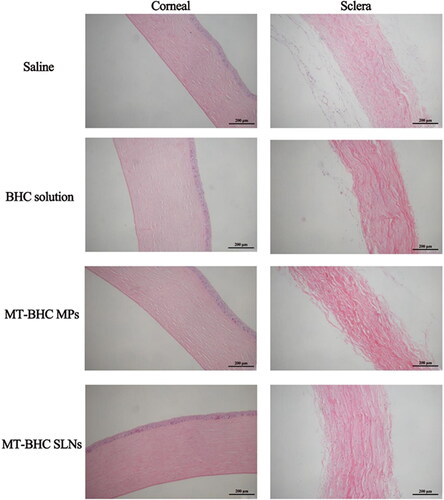
Table 7. Blink frequency after eye drop administration (data expressed as the mean values ± SD, n = 6).