
Figures & data
Table 1. 24 full factorial design for the formulation of ETO/FAM floating raft systems (RS): factors and responses.
Table 2. Design of the prepared ETO/FAM RS in actual values (uncoded units) and their calculated responses.
Figure 1. Dissolution Profiles of ETO/FAM release from different gastroretentive RS formulations. Each point represents the mean value ± standard deviation (n = 3).
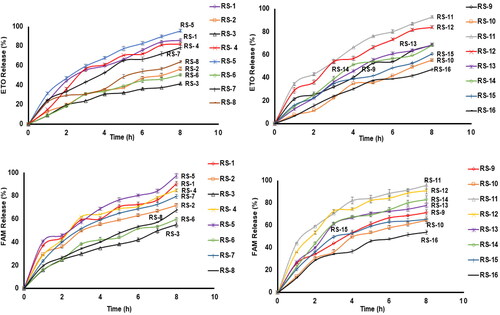
Table 3. Release kinetics pattern for different ETO/FAM RS.
Figure 2. Viscosity flow curves of ETO/FAM RS formulations.
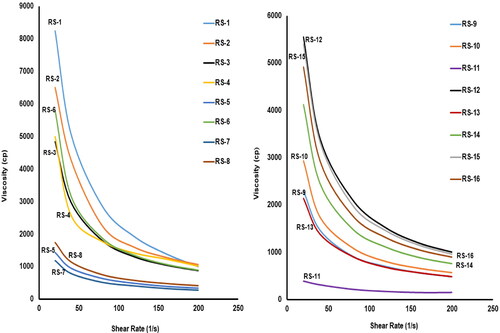
Table 4. Viscosity data results of the ETO/FAM RS.
Figure 3. Response interaction plots for the effect of significant formulation variables on the simultaneous prediction of all responses; Gelation lag time (a), Floating lag time (b), ETO release % after 1 h (c), and FAM release % after 1 h (d), ETO release % after 8 h (e), and FAM release % after 8 h (f).
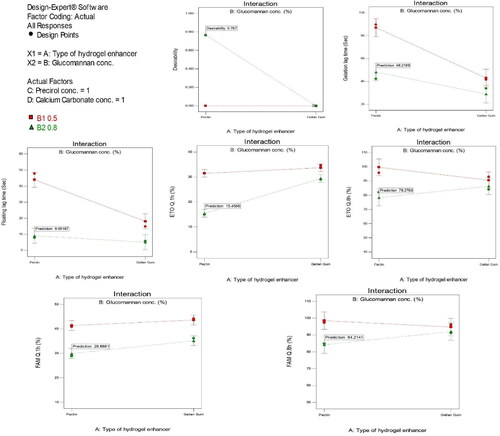
Table 5. Effect of storage conditions on the physical properties of optimum ETO/FAM RS after time intervals (45 and 90 days) at both 4 and 25 ± 3 °C.
Figure 4. DSC thermograms of pure ETO, FAM, KGL, Precirol®, pectin, Na alginate, and the physical mixture of optimized raft system (ORS).
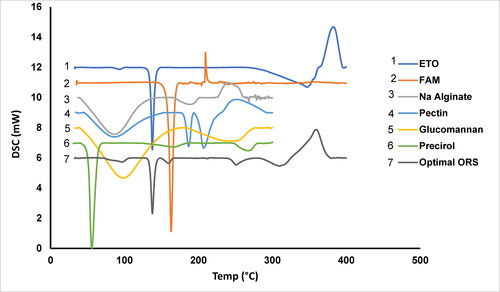
Figure 5. FT-IR spectra of pure ETO, FAM, Na alginate, pectin, and KGL and the physical mixture of optimized raft system (ORS).
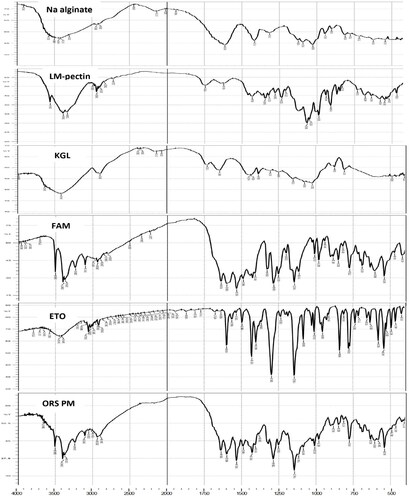
Figure 6. X-ray images of the ORS (BaSO4-loaded) representing its location in the abdomen of a human volunteer at different time intervals (hours).
Note: The location of the ORS is represented with an arrow.
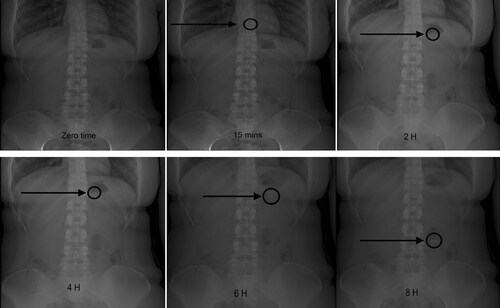
Figure 7. Average plasma concentration-time profiles after single oral administration of the ORS formulation, the marketed ETO (Arcoxia®), and the marketed FAM (Antodine®) to six human volunteers. Each point represents the mean values ± standard deviation (n = 6).
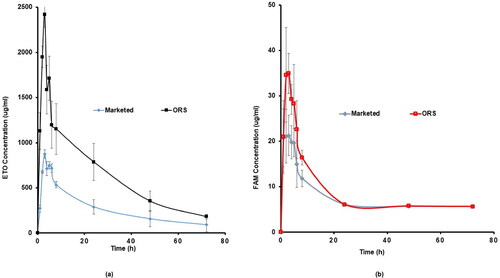
Table 6. Pharmacokinetic parameters for Arcoxia® (60 mg), Antodine® (20 mg), and ORS (comprising 60 mg of ETO and 20 mg of FAM) after oral administration to six healthy volunteers (n = 6).