
Figures & data
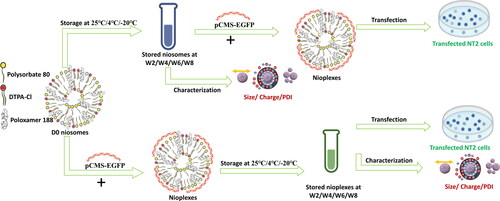
Figure 1. The chemical structure of DPP80 cationic niosomes [Polysorbate80 (P80), Poloxamer188 (P) and cationic lipid (DTPA-Cl) (D)] and a diagrammatic illustration for the method of niosome elaboration.
![Figure 1. The chemical structure of DPP80 cationic niosomes [Polysorbate80 (P80), Poloxamer188 (P) and cationic lipid (DTPA-Cl) (D)] and a diagrammatic illustration for the method of niosome elaboration.](/cms/asset/d446214a-9991-454c-bb81-06f0b4096b9c/idrd_a_2219420_f0001_c.jpg)
Figure 2. A preliminary biophysical study of DPP80 niosomes and DPP80-EGFP nioplexes. (A) the Physical features of niosomes in terms of size (nm) (bars), PDI (green line), and zeta potential (mV) (blue line) after 2 weeks of storage at 25 °C, 4 °C and -20 °C compared to day zero (D0) values. The values exemplify the mean ± SD (n = 3); ‘*’ indicates a significant difference compared to D0 (P < 0.05); ‘ns’ indicated insignificant difference. (B) The physical features of nioplexes (at a 6/1 mass ratio) in terms of size (nm) (bars), PDI (green line), and zeta potential (mV) (blue line) after 2 weeks of storage at 25 °C compared to day zero values. (C) Cryo-TEM-based morphological assessment of nioplexes at a 6/1 mass ratio. (D) Transfection of NT2 cells with nioplexes at different cationic lipid/DNA mass ratios, 24 h post-transfection. Transfection efficiency is represented as the percentage of EGFP-expressing cells (green bars), cell viability (blue line) and mean fluorescence intensity (MFI) (red line). L2K is lipofectamine® 2000 (as a positive control).
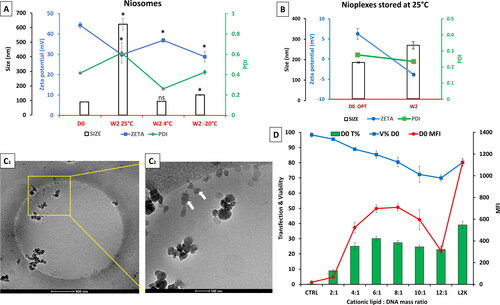
Figure 3. A Schematic representation of the experimental study design. (A) Represents the storage of niosomes at 25 °C, 4 °C and -20 °C up to 8 weeks. The thawed niosomes are complexed with pCMS-EGFP at a 6/1 N/P mass ratio to form nioplexes to transfect NT2 cells. (B) The freshly prepared niosomes are immediately complexed with pCMS-EGFP at a 6/1 N/P mass ratio that are stored later at 25 °C, 4 °C and -20 °C for up to 8 weeks. The thawed nioplexes are used to transfect NT2 cells.
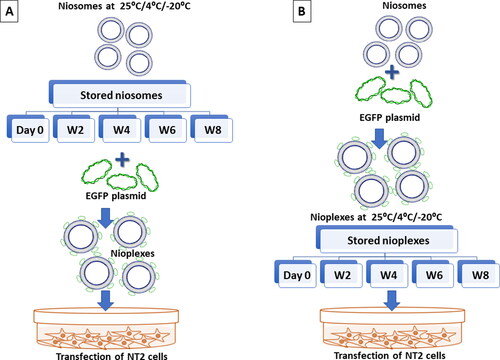
Figure 4. Physicochemical characterization of niosomes stored at 4 °C (A) and at -20 °C (B) over time (day zero up to week 8) in terms particle size (bars), zeta potential (blue line) and PDI (green line). Each data point represents the mean ± SD (n = 3); ‘*’ indicates a significant difference compared to D0 (P < 0.05).
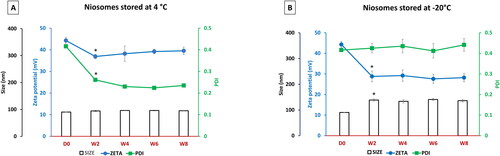
Figure 5. (A) Biological performance of 6/1 nioplexes prepared by niosomes stored at 25 °C, (B) at 4 °C and (C) at -20 °C, in terms of transfection efficiency (bar graphs), cell viability (green line graphs) and MFI (red line graph). Each data point represents the mean ± SD (n = 3). (D) Overlay of fluorescence and phase-contrast micrographs of NT2 cells transfected with nioplexes prepared by day zero niosomes (D1), and nioplexes prepared by niosomes stored for 8 weeks at 4 °C and -20 °C (D2 and D3, respectively). Original magnification x100.
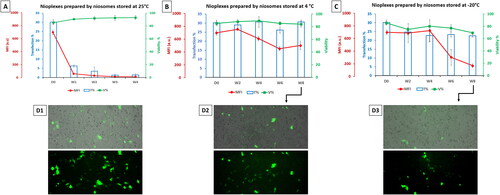
Figure 6. (A) Physicochemical characterization of nioplexes stored in Opti-MEM at 4 °C and (B) at -20 °C over time (day zero D0 up to week 8) in terms particle size (bars), zeta potential (blue line) and PDI (green line). Each data point represents the mean ± SD (n = 3); ‘*’ indicates a significant difference compared to D0 (P < 0.05).
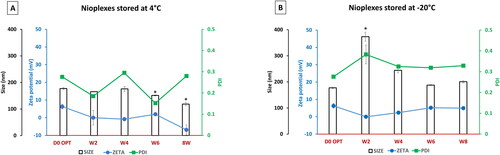
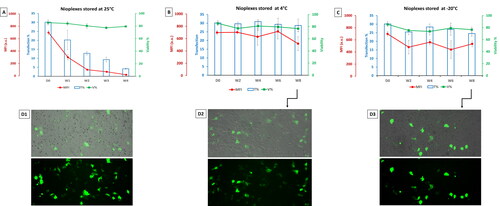
Figure 7. (A) Biological performance of nioplexes stored at 25 °C, (B) at 4 °C and (C) at -20 °C, in terms of transfection efficiency (bar graphs), cell viability (green line graphs) and MFI (red line graph). Each data point represents the mean ± SD (n = 3). (D) Overlay of fluorescence and phase-contrast micrographs of NT2 cells transfected with day zero (D0) nioplexes (D1), and nioplexes stored for 8 weeks at 4 °C and -20 °C (D2 and D3, respectively). Original magnification x100.
Data availability statement
The data that support the findings of this study are available from the corresponding author, [José Luis Pedraz], upon reasonable request.