
Figures & data
Table 1. Purity, sequence, and molecular weight (MW) of the LAH4-L1 and PEGylated peptides.
Figure 1. The physicochemical characterization of different peptide/mRNA nano self-assemblies. (A) Hydrodynamic diameters of different peptides/luciferase mRNA nano self-assemblies prepared at a 5:1 to 15:1 ratio (w/w) were measured by dynamic light scattering (DLS). (B) The polydispersity indexes (PDIs) of peptides/EGFP mRNA self-assemblies prepared at a 5:1 to 15:1 ratio (w/w) measured by DLS. Data are plotted as mean ± SEM (n = 3). (C–E) Transmission electron microscopy (TEM) images of LA/mRNA, PEG12LA/mRNA, and PEG24LA/mRNA nano self-assemblies. Scale bar = 200 nm.
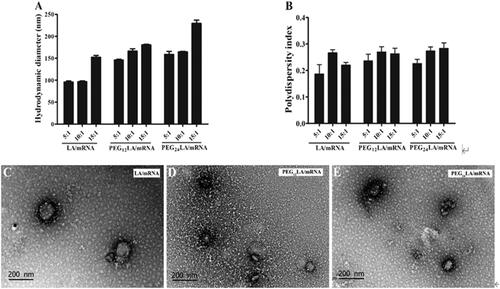
Figure 2. Agarose gel electrophoresis assay to evaluate the ability of EGFP and luciferase mRNA binding (A–C) and release (D) of the non-PEGylated and PEGylated peptide vectors. For mRNA binding, peptides/mRNA self-assemblies were prepared from a 0.5:1 to 15:1 ratio (w/w). For mRNA release, peptides/luciferase mRNA self-assemblies were prepared at a 5:1 ratio (w/w) and different concentrations of sodium dodecyl sulfate (SDS) solutions were added to dissociate luciferase mRNA from the self-assemblies. Unbound mRNA and peptide/mRNA self-assemblies without SDS treatment were used as controls. Electrophoresis was carried out at 140 V for 40 min, and the gel was visualized under UV illumination.
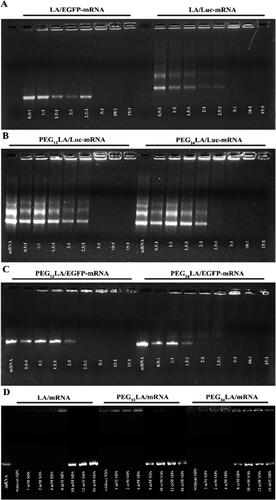
Figure 3. MTT cytotoxicity assay of peptides and peptides/mRNA self-assemblies on A549 cells (A,C) and HepG2 cells (B,D). (A) MTT results of different concentrations of peptides on A549 cells. (B) MTT results of different concentrations of peptides on HepG2 cells. (C) MTT results of peptides/mRNA self-assemblies prepared at a 5:1 to 15:1 ratio (w/w) on A549 cells. (D) MTT results of peptides/mRNA self-assemblies prepared at a 5:1 to 15:1 ratio (w/w) on HepG2 cells. The cell viability (%) was calculated by comparing the absorbance of cells treated with different peptides or peptides/mRNA self-assemblies to the untreated cells. The data were analyzed by one-way ANOVA followed by tukey’s post-hoc multiple comparison tests (*P < 0.05, **P < 0.01, ***P < 0.001). data are plotted as mean ± SEM (n = 3).
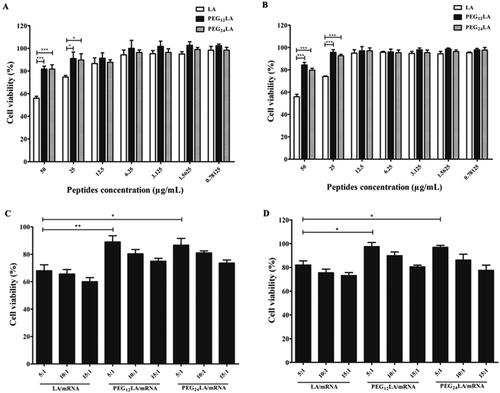
Figure 4. Cellular uptake study of Cy5 fluorescently labeled mRNA by flow cytometry. The percentage of Cy5 fluorescent positive cells (A,B), the representative histograms (C,D) that displayed Cy5 positive cells (red) compared to untreated cells (blue), and the mean fluorescence intensity of A549 and HepG2 cells treated with different peptide/Cy5-mRNA self-assemblies at 5:1 w/w ratio (E,F) were shown. Data are plotted as mean ± SEM (n = 3). The data were analyzed by one-way ANOVA followed by tukey’s post-hoc multiple comparison test. Black *P < 0.05, **P < 0.01 and ***P < 0.001 comparisons among different peptides/mRNA self-assemblies at the same ratio (w/w); blue *P < 0.05 and ***P < 0.001 significant difference between the peptide/mRNA self-assemblies and LipofectamineTM 2000/mRNA lipoplexes; red *P < 0.05 and ***P < 0.001 vs. the naked mRNA group.
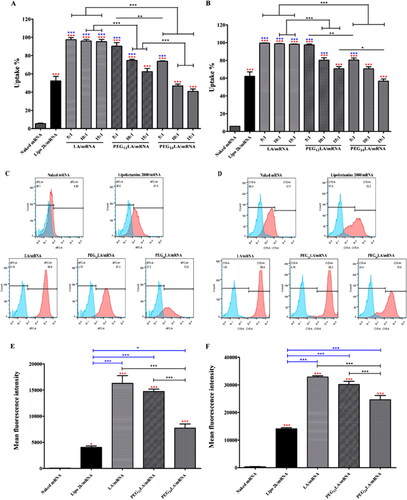
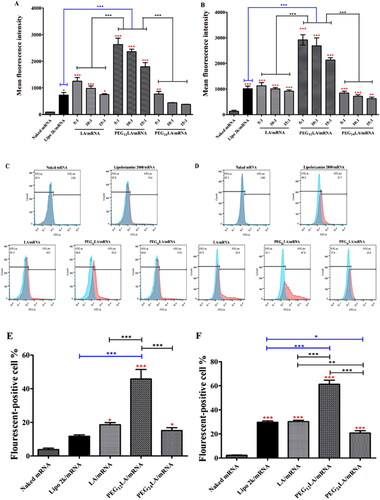
Figure 5. EGFP mRNA transfection study using flow cytometry. The transfection efficiencies of naked mRNA or different vector/mRNA self-assemblies prepared at different mass ratios (from 5:1 to 15:1) on A549 cells (A) and HepG2 cells (B). (C and D) Representative histograms show the percentage of cells that displayed positive EGFP fluorescence signals (red) compared to untreated cells (blue) using 2 μg EGFP mRNA at a 5:1 w/w ratio of peptide/mRNA self-assemblies or 2:1 w/w ratio of LipofectamineTM 2000/mRNA lipoplexes on A549 cells (C) and HepG2 cells (D). (E) and (F) the EGFP fluorescent-positive cell percentage of different vector/mRNA self-assemblies compared to naked mRNA on A549 (E) and HepG2 cells (F). Data are plotted as mean ± SEM (n = 3). The data were analyzed by one-way ANOVA followed by tukey’s post-hoc multiple comparison test. Black **P < 0.01 and ***P < 0.001 comparisons among different peptides/mRNA self-assemblies at the same ratio (w/w); blue *P < 0.05 and ***P < 0.001 comparisons between LipofectamineTM 2000/mRNA lipoplexes and peptide/mRNA self-assemblies; red *P < 0.05 and ***P < 0.001 comparisons between different vector/mRNA self-assemblies and the naked mRNA group.
Supplemental Material
Download MS Word (4.4 MB)Data availability statement
The authors confirm that the data supporting the findings of this study are available within the article and its supplementary materials.