Figures & data
Table 1. Composition of ME formulations.
Table 2. Composition of MEG formulations.
Figure 1. Screening excipients. Solubility of TA in various oils (a), surfactants (B), and cosurfactants (C), respectively. (D) Droplet size of Capmul with different surfactants. (E) Pseudo-ternary phase diagrams for selecting cosurfactants.
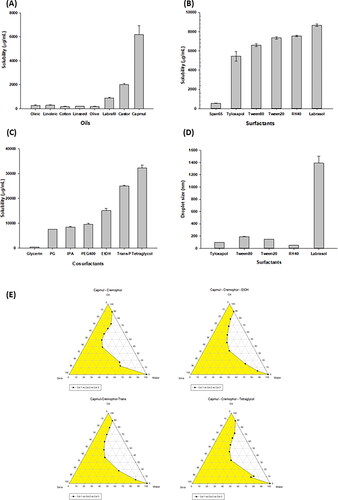
Figure 2. Pseudo-ternary phase diagrams for selecting Smix.
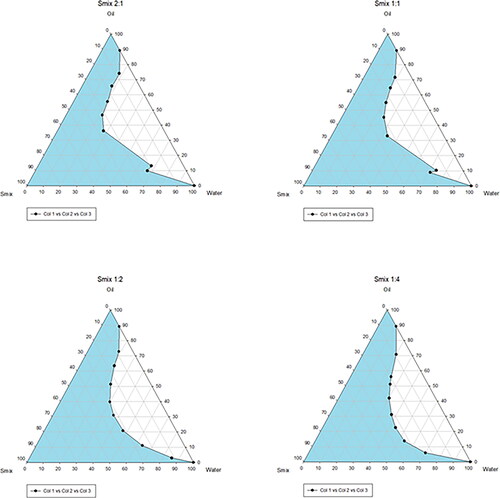
Table 3. Drug solubility and droplet size of ME formulations (n = 3).
Table 4. Thermodynamic stability of ME-3 and ME-7 formulations.
Table 5. Gelation ability and gelation time of MEG formulations.
Figure 3. Syringeability time and gel degradation of MEG formulations. (A) Syringeability time and (B) gel degradation.
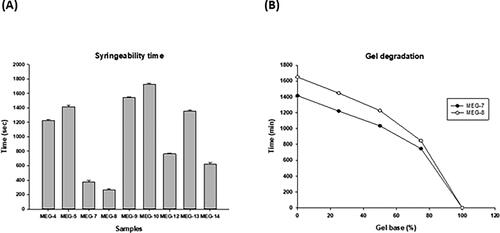
Figure 4. Drug release profiles of TA-Sol, TA-ME, and TA-MEG (mean ± SD, n = 3).
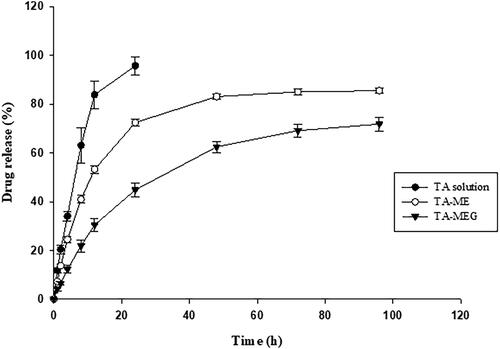
Table 6. Parameters of each model applied to selected samples.
Table 7. Characteristics of optimized TA-MEG on stability test.
Figure 5. Cell viability of TA-Sol, TA-ME, and TA-MEG on NIH-3T3 cells (mean ± SD, n = 3).
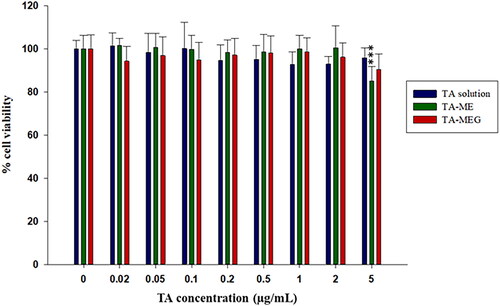
Figure 6. In vivo fluorescence images of mice after intratympanic administration of Rho-Sol, Rho-ME, and Rho-MEG.
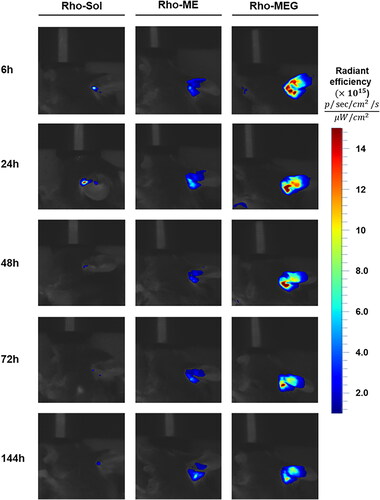
Figure 7. The radiant efficiency calculated from in vivo fluorescence imaging after selecting appropriate ROIs using CleVueTM software (mean ± SD, n = 3).
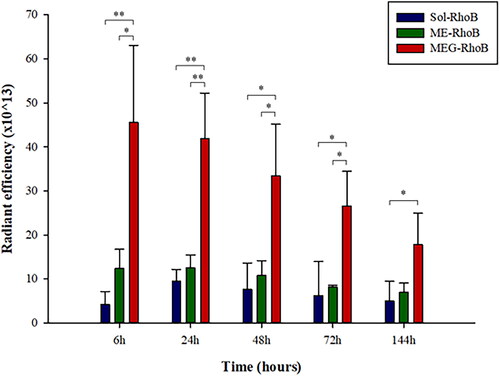
Figure 8. The cochlear distribution profiles of TA after intratympanic administration of TA-Sol, TA-ME, and TA-MEG in SD rats (mean ± SD, n = 3).
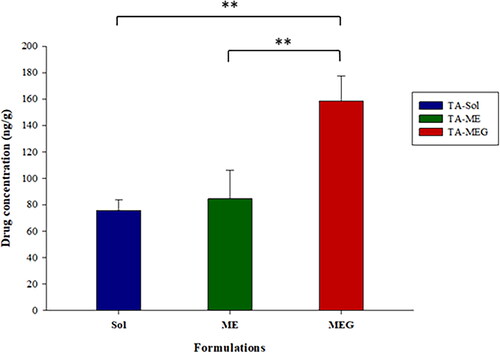
Figure 9. Histological sections of inner ear samples of mice after intratympanic injection. H&E staining was performed on inner ear sections from mice of (A) control group, (B) TA-Sol group, (C) TA-ME group, and (D) TA-MEG (n = 3 each group). OC, organ of Corti; SGN, spiral ganglion neuron; SV, stria vascularis. In each of the low-magnification images (right panel), a dotted-line rectangle shows where a high-magnification image of the spiral ganglion cells (right panel).
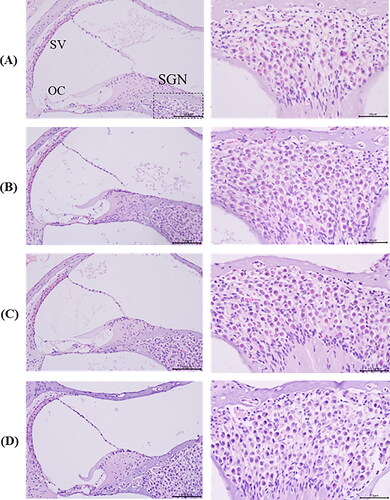
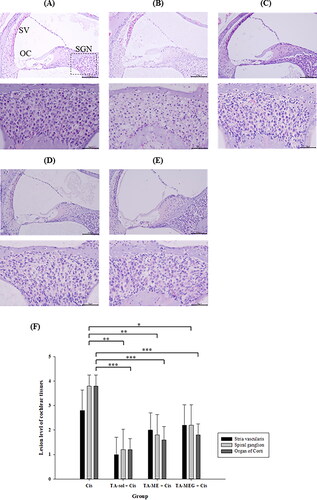
Figure 10. Oto-protective effect outcomes afforded by TA-Sol, TA-ME and TA-MEG intratympanic administration in a mouse cisplatin-induced ototoxicity model. (A)–(E). Photomicrographs of stria vascularis (SV), spiral ganglion neurons (SGN) and organ of Corti (OC) in the cross sections of the whole cochleae, H&E staining. (A) Control group, (B) Cisplatin group, (C) TA-Sol group, (D) TA-ME group, and (E) TA-MEG group (n = 4-5 each group). In each of the low-magnification image (upper panel), a dotted-line rectangle shows where a high-magnification image of the spiral ganglion cells (lower panel). (F) Lesion level of cochlear tissues (stria vascularis, spiral ganglion neurons and organ of Corti) evaluated on semi-quantitative scale (mean ± SD, n = 4-5).