Figures & data
Table 1. Selected domains of the World Health Organization’s International Classification of Functioning Disability and Health (ICF).
Figure 1. Schematic representation of spatio-temporal and kinematic parameters recorded through inertial measurement units. The investigated spatio-temporal and kinematics variables are reported into the white boxes.
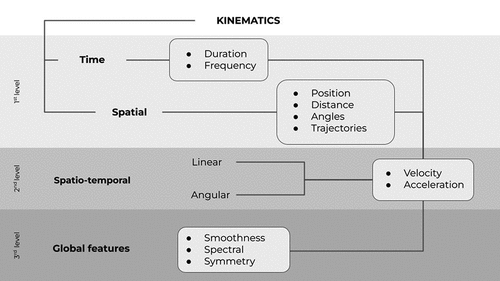
Table 2. Synoptic table of studies included in the passive range of motion assessment (b710) of the ICF domain.
Table 3. Synoptic table of studies included in the muscle tone functions (b735) of the ICF domain.
Table 4. Synoptic table of studies included in the voluntary movements assessment (b760) of the ICF domain.
Table 5. Synoptic table of studies included in the object manipulation and daily life activity assessment (d445) of the ICF domain.
Figure 2. Flow diagram of studies selection process (PRISMA ver. 2020).Citation28 *All records were excluded by humans.
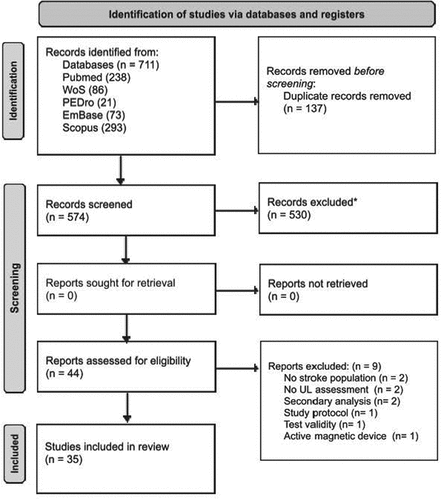
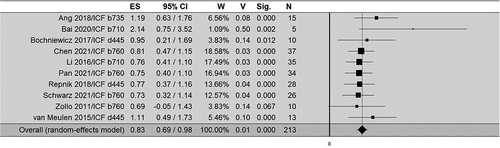
Figure 3. Forest plot for the random effect model correlation meta-analysis between kinematics and clinical data. The continuous line indicates no correlation (right and left, positive and negative correlation, respectively). The dashed line indicates the pooled Z-score. ES: effect size; CI: confidence interval; W: weight; V: variance; Sig.: statistical significance; N: sample number. StudiesCitation30,Citation44 allocated to more than one ICF’ subgroups were considered for meta-analysis only in their dominant subgroup.