
Figures & data
Table 1. Descriptive Statistics for BELS Subtests: Controls and Stroke (LHS & RHS).
Table 2. Percentage of patients (and Proportion of LHS: RHS) Impaired on BELS Subsections.
Table 3. Inferential statistics for BELS subtests: Comparison of controls and stroke groups.
Figure 1. ROC Curve for BELS Total Score.
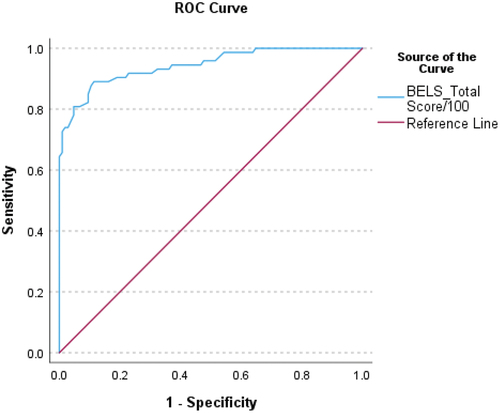
Table 4. ROC curve statistics and cutoffs for BELS total score.
Supplemental material