Figures & data
Table 1 Demographics, clinical characteristics and surgical procedures included among the tetraplegic individuals.
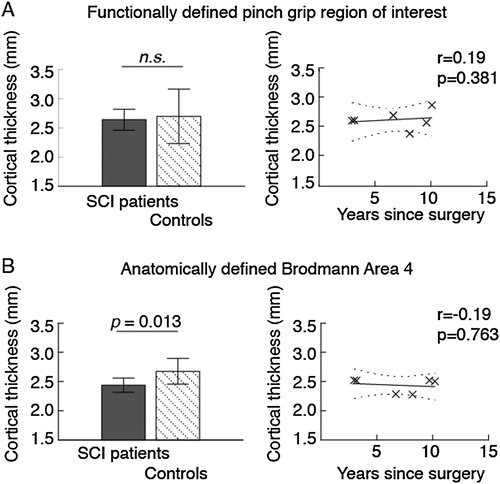
Figure 1 Gray matter thickness in (A) functionally and (B) anatomically defined areas of the primary motor cortex. Bar charts show cortical thickness in patients and control participants. The scatter plot shows patients’ cortical thickness as a function of time since reconstructive surgery, while controlling for age. Error bars indicate standard deviations, and the dotted lines show the 95% confidence bounds. Abbreviations: n.s., not significant; SCI, spinal cord injury.