
Figures & data
Figure 1 Functional electrical stimulation electrodes and reflective marker placements. (a) Anterior view and (b) posterior view
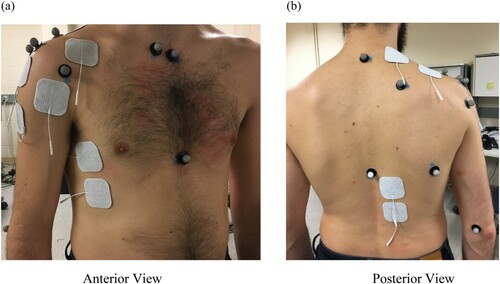
Table 1 Participant demographics.
Table 2 FES intensity in milliamperes (mA) for individual muscles for each study participant.
Figure 2 Means of the maximum arm reach across all experimental conditions. AFF – Active forward flexion; AD – FES of anterior deltoid; ADALL – FES of anterior deltoid along with LT, UT and SA; AB – Active abduction; MD – FES of middle deltoid; ABALL – FES of middle deltoid along with LT, UT, and SA
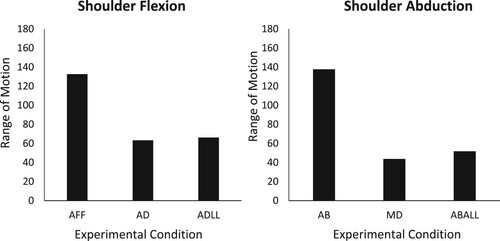
Figure 3 Displacement of the arm in flexion and abduction for one study participant (SCA18) across all experimental conditions. X-axis is the time in seconds and Y-axis is the displacement of the upper arm in degrees. AFF – Active forward flexion; AD – FES of anterior deltoid; ADALL – FES of anterior deltoid along with LT, UT, and SA; AB – Active abduction; MD – FES of middle deltoid; ABALL – FES of middle deltoid along with LT, UT, and SA
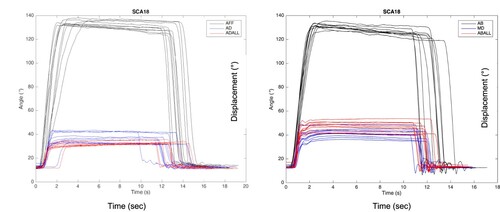
Table 3 Maximum reach in degrees across ten trials for each experimental condition for individual study participant.