
Figures & data
Table 1. Participant demographics and injury characteristics
Figure 1 Kaplan-Meier curve for time to first fall. Participants who did not experience falls during the six-month period are reported as censored events.
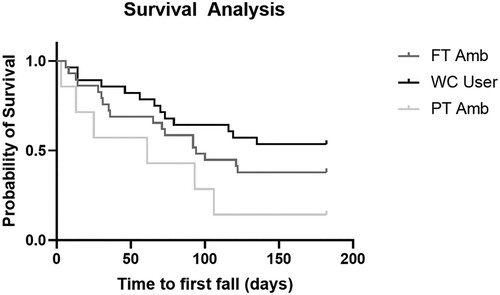
Table 2 Fall circumstances by mobility status.
Table 3 Activity during a fall for individuals who ambulated full-time, used a wheelchair full-time and ambulated part-time.
Table 4 Causes of falls experienced by individuals who ambulated full-time, used a wheelchair full-time and ambulated part-time.