Figures & data
Table 1. Demographic information of sample (N = 49)
Figure 1 The image on the left shows the Newest Vital Sign nutrition label as it appears in the health literacy assessment. The image on the right shows how the area of interest (AOI) tool was used in the Tobii Studio software to draw boxes around each piece of information on the NVS label. Each box is a separate AOI.
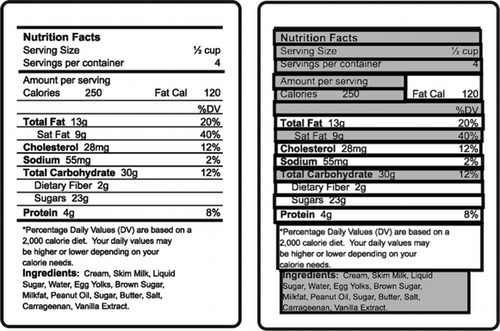
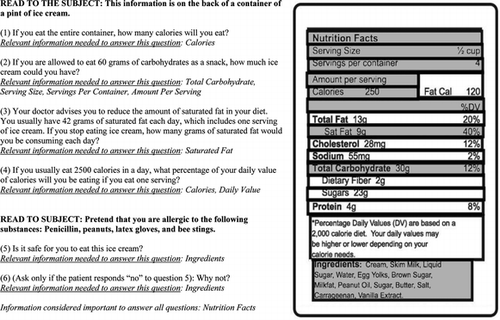
Figure 2 The Newest Vital Sign (NVS) Measure of Health Literacy: Relevant and nonrelevant information details on the NVS nutrition label deemed relevant for answering each of the six NVS questions are highlighted in gray. Details that are not relevant for answering NVS items are shown on the label in white.