Figures & data
Table 1. Descriptive student demographics by condition.
Figure 1. Example word with the Readable English markup. Example of Readable English markup. Readable English© (Citation2021). Reprinted with permission.
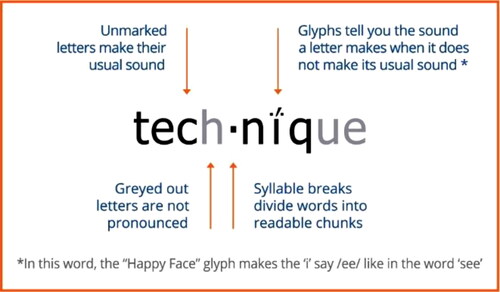
Table 2. T-test comparisons of pretest measures between condition groups.
Table 3. Pretest, posttest, and change means of reading skills assessments.
Table 4. Descriptive categories corresponding to standard scores and standard deviations from the mean.
Figure 2. Mean change in EasyCBM passage reading accuracy measured in percentage of words read correctly per minute.
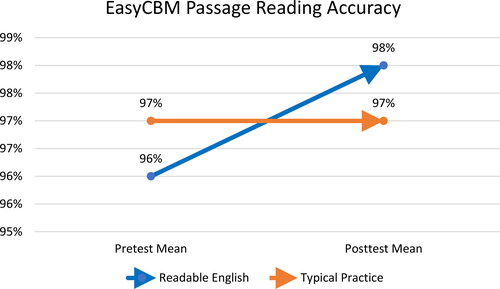
Table 5. ANCOVA of EasyCBM reading skills growth controlling for treatment condition, grade level, gender, special education eligibility, and prior knowledge*.
Figure 3. Mean change in EasyCBM passage reading rate measured by the number of words read correctly per minute.
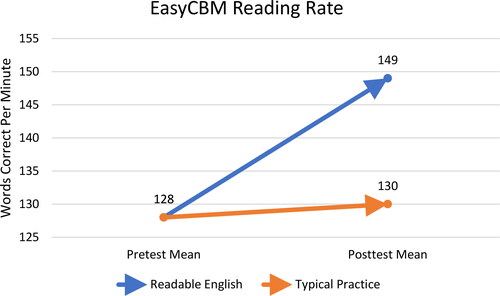
Figure 4. Mean raw score change in EasyCBM CCSS basic reading comprehension.
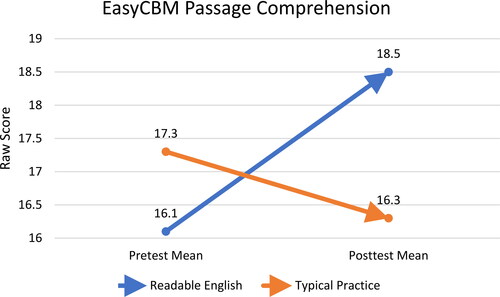
Table 6. ANCOVA of WRMT-3 reading skills growth controlling for treatment condition, grade level, gender, special education eligibility, and prior knowledge*.
Figure 5. Mean change in WRMT-3 oral reading fluency measured by growth scale values.
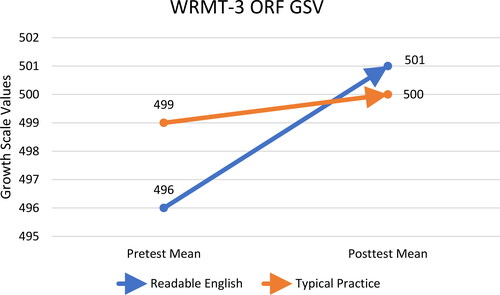
Figure 6. Mean change in WRMT-3 passage reading comprehension measured in growth scale values.
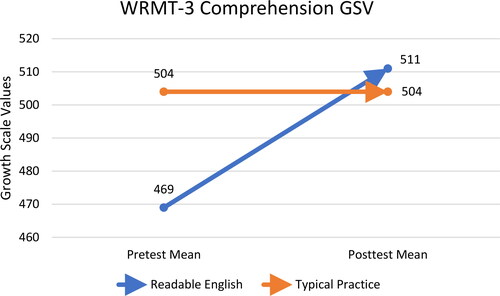
Figure 7. Mean change in WRMT-3 oral reading fluency measured in grade equivalents. Note. Each tenth of a grade level equals one month of growth.
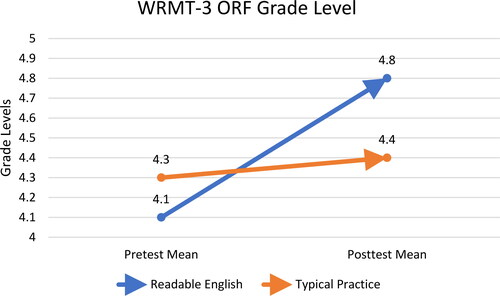
Figure 8. Mean change in WRMT-3 passage reading comprehension measured in grade equivalents. note. Each tenth of a grade level equals one month of growth.
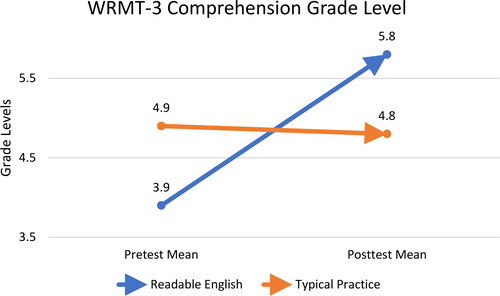
Figure 9. Mean change in WRMT-3 oral reading fluency measured in standard scores.
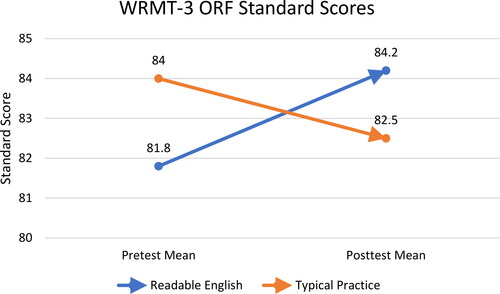
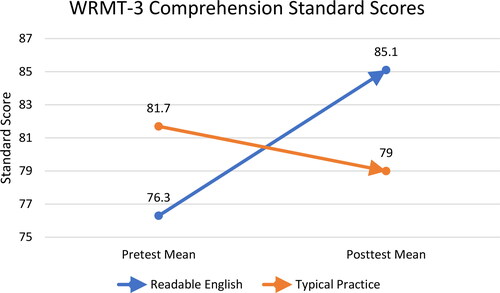
Figure 10. Mean change in WRMT-3 passage reading comprehension measured in standard scores.