Figures & data

Figure 1. Chemical structures of GM1, GD1a, GT1b, GQ1b gangliosides. Gangliosides with d36:1 ceramides. Gal is galactose, GalNAc is N-acetylgalactosamine, Glc is glucose and NeuAc is N-acetylneuraminic acid (sialic acid).
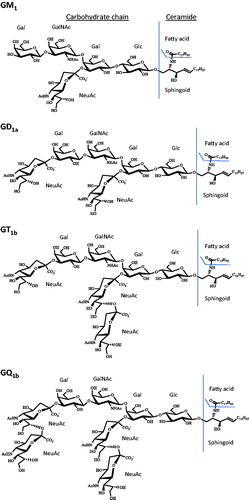
Table 1. Mass spectrometric parameters for optimal determination of the various gangliosides.
Figure 2. GM1 gangliosides (d36:1) product ion scan. Product ion scan (Q3 scan) showing the fragmentation of GM1 ganglioside (m/z 1545) resulting in the dehydrated sialic acid product ion (m/z 290.1).
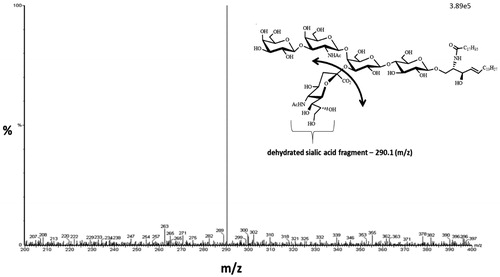
Figure 3. Mobile phase optimization studies: methanol versus acetonitrile and addition of ammonium hydroxide. LC-MS/MS chromatograms of GT1b (red), GD1a (green) and GM1 (black) bovine brain gangliosides. (a) Linear gradient of mobile phase A (100% water) and mobile phase B (100% acetonitrile), 45% B to 90% B in 8 min. (b) Linear gradient of mobile phase A (100% water) and mobile phase B (100% methanol), 55% B to 95% B in 8 min. (c) Linear gradient of mobile phase A (100% water adjusted to pH 9 with ammonium hydroxide) and mobile phase B (100% methanol adjusted to pH 9 with ammonium hydroxide), 60% B to 100% B in 8 min.(d) Linear gradient of mobile phase A (100% water adjusted to pH 10 with ammonium hydroxide) and mobile phase B (100% methanol adjusted to pH 10 with ammonium hydroxide), 55% B to 95% B in 8 min.
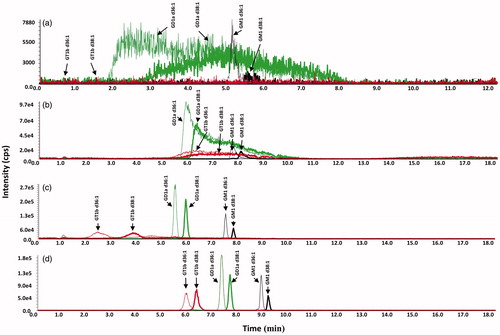
Table 2. Interday precision: percent coefficient of variation (% CV) of peak area ratio [standard/internal standard (IS)].
Table 3. Matrix effect studies: comparison of ganglioside peak areas of 100x diluted mouse superior colliculus sample with theoretical peak areas from the standard calibrator.
Figure 4. Superimposed MRM chromatograms of bovine brain gangliosides. Chromatograms of GQ1b (blue), GT1b (red), GD1a (green) and GM1 (black), each at 25 ng/mL. The 25 ng/mL is the combined concentration for all gangliosides differing in ceramide for each particular class (GQ1b 25 ng/mL, GT1b 25 ng/mL, GD1a 25 ng/mL, and GM1 25 ng/mL). The diagonal line plot is the actual % methanol vs time, corrected for time for a gradient change to reach the mass spectrometer detector (1.43 min). Not evident, because of the scale used, are trace amounts of GT1b d34:1 and GQ1b d40:1 eluting at 11.4 and 12.2 min, respectively.
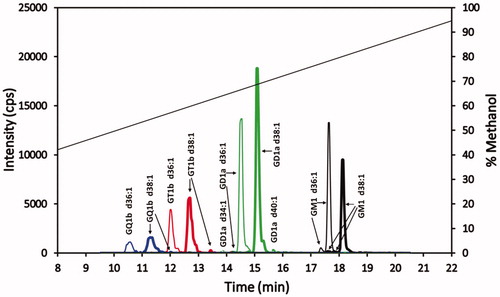
Figure 5. Ganglioside profile of mouse superior colliculus sample. Chromatogram of 20 ng/mL of a superior colliculus sample from a single mouse prepared as given in the Materials and methods section. See caption for color identification of ganglioside class and diagonal line specifics.
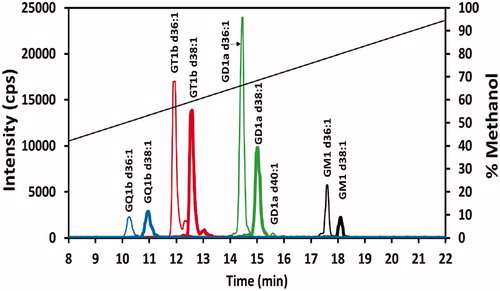
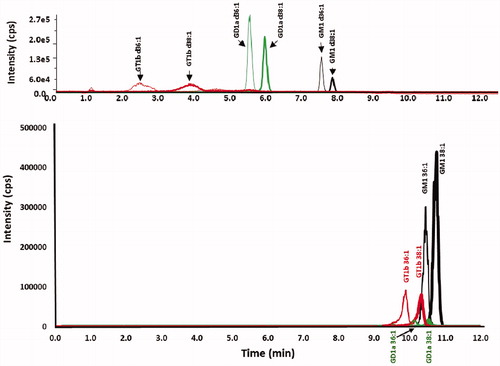
Figure 6. Chromatograms of ganglioside standards chromatographed with a methanol gradient at pH 9 on both a phenyl-hexyl and a C18 column. Chromatograms of GT1b (red), GD1a (green) and GM1 (black) standards for (top) XBridge BEH phenyl-hexyl column and (bottom) Zorbax Eclipse Plus C18 column, employing a linear gradient of mobile phase A (100% water adjusted to pH 9 with ammonium hydroxide) and mobile phase B (100% methanol adjusted to pH 9 with ammonium hydroxide), 60% B to 100% B in 8 min.