
Figures & data
Figure 1. Popularity for the terms “electronic cigarette” (blue) and “e-cigarette” (red), “vape” (black) and “vaping” (purple) expressed as RSV over time. Declining slope indicates decrease in popularity of the search term.
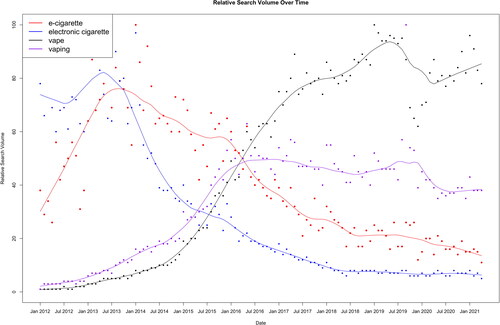
Figure 2. Cross correlation to measure the data synchronicity between the actual prevalence data and the Google trend’s data. The horizontal blue lines represent the upper and lower confidence bounds so lag 0 indicates a statistically significant correlation, suggesting that the data are strongly matched in both trend and directionality.
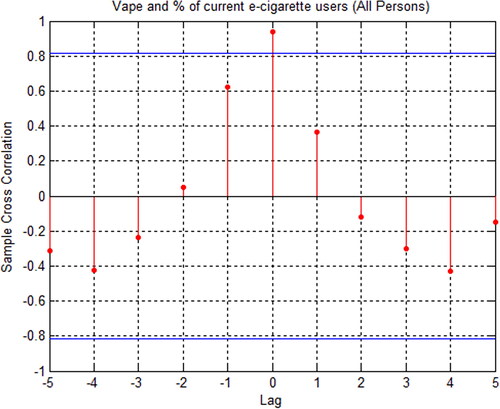
Figure 3. Predictability of ARIMA model (blue line) in forecasting the online interest in vaping versus actual Google trend’s data (black line) for 2019 to 2020 with confidence intervals of 80% and 95% respectively.
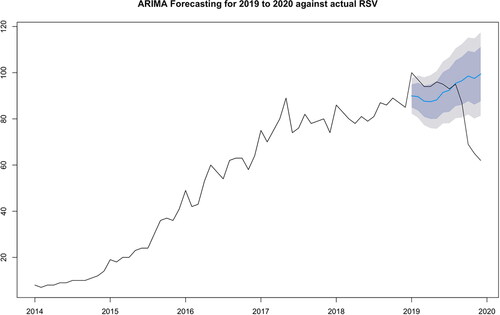
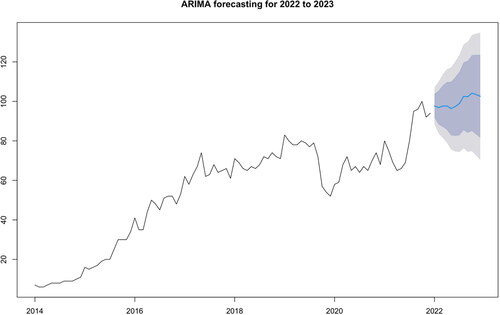
Figure 4. ARIMA model forecasting the online interest in vaping for 2020 to 2023 with confidence intervals of 80% and 95% respectively.
Data availability statement
The data underlying this article are available in Google Trends website at https://trends.google.com/trends/explore?q=vaping&geo=GB
The codes for the analysis hereinafter referred to as “R codes” will be shared on reasonable request to the corresponding author. Please note that to run the “R codes” appropriate statistical software is needed.