
Figures & data
Table 1. Description of the population, of the administration of questionnaires and of the educational context.
Table 2. Descriptives of students’ perception of their educational context and of learning approaches: mean scores (SD) and change in scores of variables by educational context (95% confidence interval CI and effect sizes).
Table 3. Correlations between variables in each educational context.
Table 4. Standardized coefficients of the paths from each dimension of students’ perception of their educational context on their learning approaches (all models 1).
Figure 1. Path analysis model showing the relationships from students’ perception of their educational context on their learning approaches (only significant relationships are indicated).
Model 1 tested all the relationships from each DREEM subscale on deep (DA) and surface (SA) learning approaches and from gender on each DREEM subscale and on deep and surface learning approaches. The model assumed that the 5 DREEM subscales were inter-correlated with one another as well as DA with SA. Only significant relationships with their beta coefficients are represented on the figure. Full lines are positive relationships and dotted lines negative relationships.
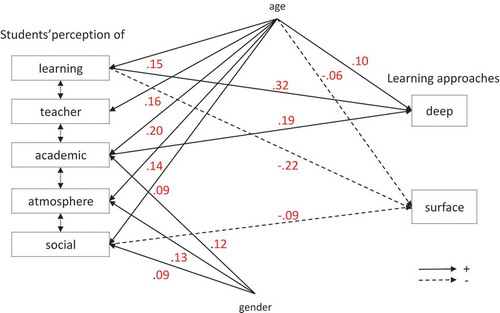
Table 5. Standardized coefficients of the paths from the integration level of the educational context and from each dimension of students’ perception of these educational contexts on their learning approach (all models 2).
Figure 2. Path analysis model showing the relationships from the integration level and the teaching format of the curriculum on students’ perception of their educational context and on their learning approaches (only significant relationships are indicated).
Model 2 tested the relationships from the integration level and the teaching format of the curriculum on students’ use of deep (DA) and surface (SA) learning approaches, postulating a direct path and an indirect path mediated via students’ perception of their educational context. The model assumed that the 5 DREEM subscales were inter-correlated with one another as well as DA with SA. Only significant relationships between integration level, teaching format, students’ perception and students’ learning approaches are represented with their beta coefficients on the figure. Full lines are positive relationships and dotted lines negative relationships.NB: The relationships between gender, age and the other variables are not represented for a matter of clarity but can be found in . All coefficients are adjusted for gender and age.
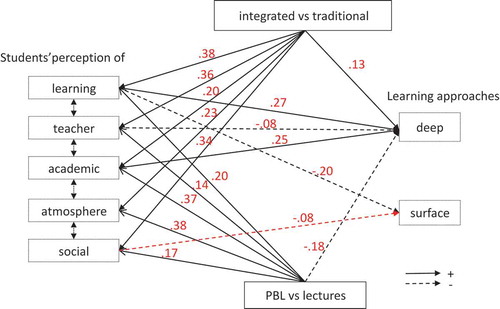
Table 6. Summary of the direct and indirect paths from the integration level of the curriculum, from the teaching format and from gender to the deep and surface learning approaches.