Figures & data
Figure 1. Illustration of hypothesised functional and dysfunctional coping strategies and their association with burnout. The use of functional coping strategies should be associated with a low probability of being burnt out. The use of dysfunctional coping strategies should be associated with a high probability of being burnt out.
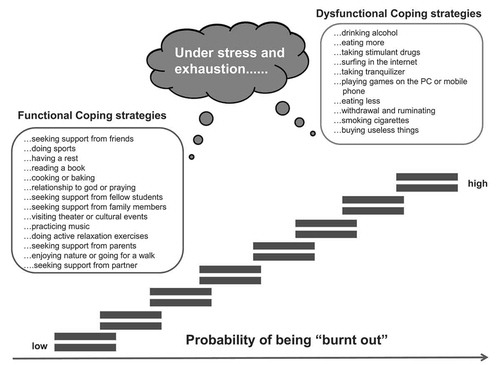
Table 1. Characteristics of study population and subgroups.
Table 2. Results for sub dimensions of the Maslach Burnout Inventory (MBI-SS).
Table 3. Results of the comparison between the investigated sample of medical students and a general student reference sample.
Table 4a. Ranking of importance of investigated functional coping strategies.
Table 4b. Ranking of importance of investigated dysfunctional coping strategies.
Figure 2. Illustration of hypothetised functional (Figure 2a) and dysfunctional (Figure 2b) coping strategies with associated odds ratios (OR). The horizontal lines represent the standard deviations and the squares are at the height of the x-axis and illustrate the respective value.