Figures & data
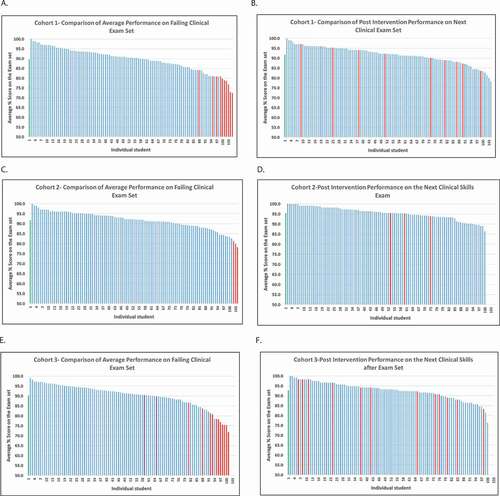
Figure 1. The column on the left (A,C and E) shows average scores of all students in the class. Each bar represents the score of one student. Blue bars: students that passed the clinical skills exam set. Red Bars: students that failed one or more stations of the clinical skills exam set. The column on the right (B, D and F) shows average scores of all students in the class on the next clinical skills exam set. Red bars: student who failed the previous exam set listed in A and then were remediated using the hybrid model. Green bar: the class average on the exam. The cohort is 103 students normally and the missing bars denote students that deferred the exam for some reason and extra bars represent additional students examined with the cohort