Figures & data
Table 1. Students overall scores of all third-year courses
Table 2. Third-year students overall scores and absence rates of the Bacteriology course
Table 3. The average final grade and absence rate for both sexes in the clinical virology course
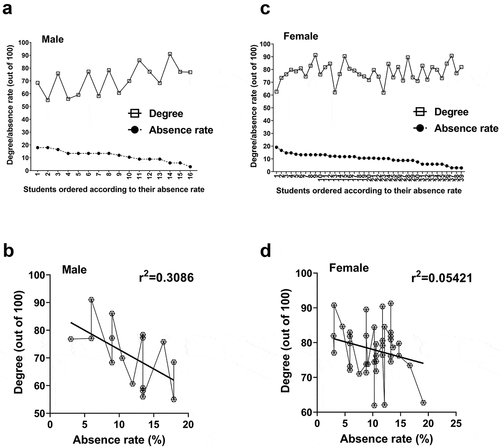
Figure 1. Correlation between absence rates and students’ final grades (January – April 2019 section). Male students exhibited a significant correlation between absence and grades (a and b) whereas a less dependent relationship between the two variables was found for female students (c and d). Male students: n = 27; Female students: n = 33
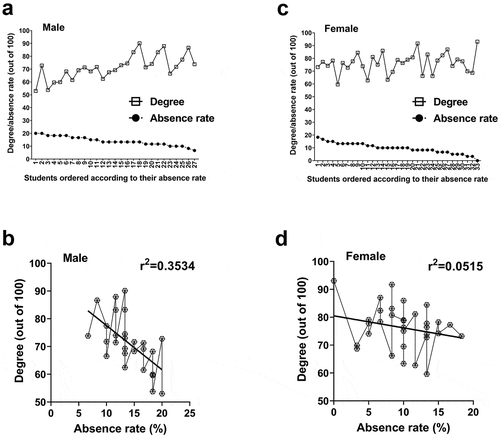
Figure 2. Correlation between absence rates and students’ final grades (September – December 2019 section). Male students displayed a significant correlation between absence and grades (a and b) whereas a less dependent relationship between the two variables was found for female students (c and d). Male students: n = 16; Female students: n = 39