Figures & data
Table 1. Demographic characteristics of participants
Table 2. Student satisfaction
Table 3. Subscales of students’ and faculty satisfaction
Table 4. Correlation between the overall satisfaction and satisfaction subscales among students
Table 5. Satisfaction among faculty
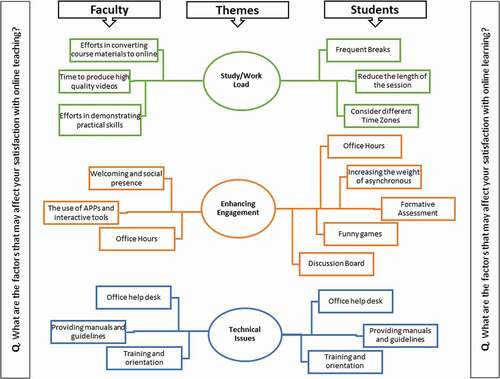
Figure 1. Thematic Network for analysis of open ended questions for students and faculty