Figures & data
Table 1. Respondent Characteristics
Figure 1. The distribution of specialty area is shown for residents (subspecialty of their LSC), alumni (current field of practice), and preceptors (subspecialty)
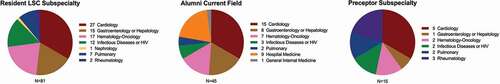
Figure 2. The distributions of resident and preceptor responses to Likert items for (a) overall satisfaction, (b) overall educational value, (c) effectiveness, and (d) curriculum and workflow. Bars to the right of the vertical baseline (0% axis) show the percentage of residents or preceptors who answered category 4 (green) or 5 (blue); bars to the left show the percentage who answered category 1 (red), 2 (orange), or 3 (yellow). The P values shown are for comparing the percentage of residents who answered category 4 or 5 with the corresponding percentage of preceptors. The pound sign (#) indicates an item posed only to alumni
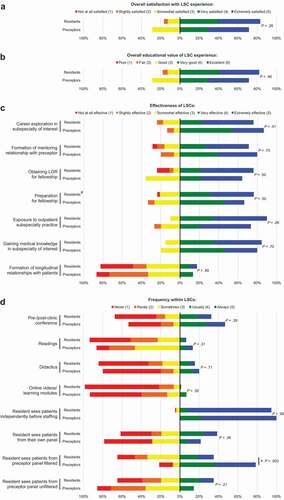
TABLE 2. Results from Content Analysis of Responses to Open-Ended Items
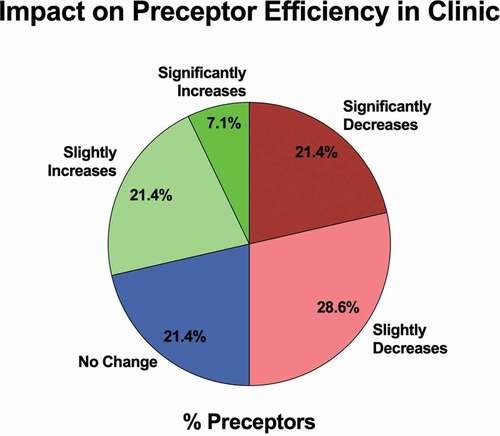
Figure 3. The impact of having an LSC resident on preceptor efficiency in clinic, with data shown as the distribution of preceptor responses