Figures & data
Figure 1. Education on the life of Ernest Everett Just, Ph.D. Participating students were questioned on the facts on aspects of the life and times of Ernest Just. The most common type of fact the participants describe was related to E.E. Just’s education; more than 25% of the participants described something such as ‘he went to my school’ or they named the universities Dr. Just attended; all of this was placed in the category of Educational Facts; Contribution to Science 52%; Perseverance 44%; Started college at 13 28%, Dedication 22%; Career facts 21% Pioneer for black 17%, finished college in 3 years 13%, Gifted 13%, Founder Omega Phi Psi 10%, Pioneer in science 8%, Pursued excellence in research 7%, English professor 7%, Life facts 7%, Pioneer for black 3%
Figure 2. Participant feedback on what they learned from the symposium speakers. Participants were asked to record things that they learned from the speakers and the overriding answers were concerned with general information on graduate schools (62%); career advice; motivational thoughts; and scientific facts
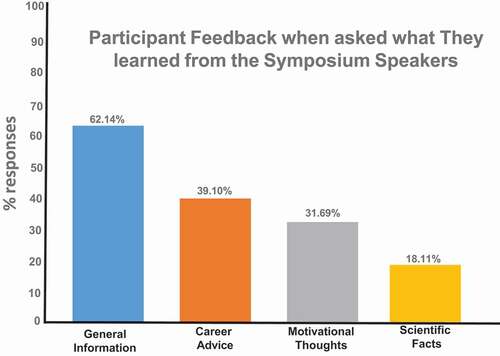
Figure 3. Demographics of the faculty role model, impact, and science speakers. The majority of the role model speakers were African American male. There were some female and Hispanic role model speakers. The science speakers Caucasian men and women
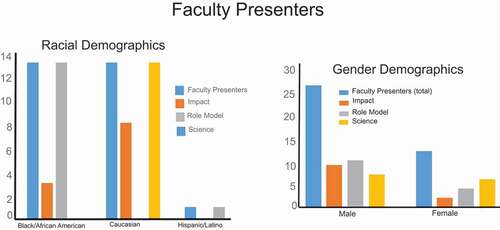
Table 1. The interest level was measured of responses of participants in pursing careers before and after the symposium by race on a scale of 1–10 (p < 0.005). In all three groups examined Caucasians, African Americans, and Hispanics the interest level in science as a career was increased. We measured the interest level of responses of participants in pursing careers before and after the symposium by gender and undergraduate, and K12. In all the examined categories the interest level in science as a career was increased after the symposium
Figure 4. Symposium attendees accepted into graduate program at MUSC from 2013–2019 We monitor and track the student accepted into graduate programs, results show that we have Medicine 130; Health Professions 85; Dentistry 55 and Graduate studies 45