Figures & data
Figure 1. Illustration of data collection and recruitment procedures – TS = training session, ASP = adolescent simulated patients. We conducted in-field observation during training sessions 1 to 6 and recruited 18 students for interviews in training sessions 1 to 4 and 6.
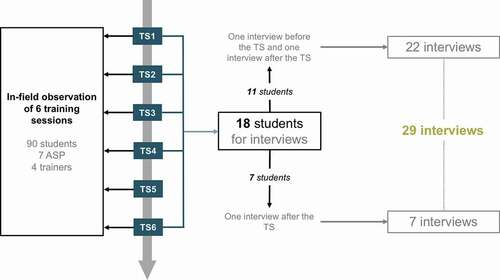
Table 1. Summary of main categories, themes and subthemes that emerged from the first phase of the data analysis (initial, focused and axial coding)
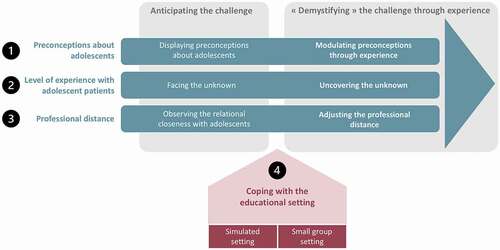
Figure 2. Illustration of the process of anticipating and ‘demystifying’ the challenge through the experience with an adolescent simulated patient