
Figures & data
Figure 1. PRISMA flow diagram illustrating the different phases of the study selection process and mapping out the number of records identified based on the inclusion and exclusion criteria.
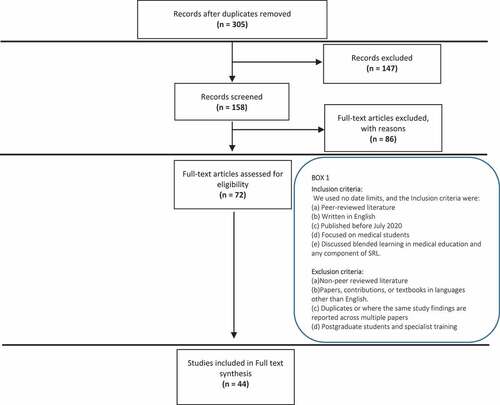
Table 1. Concepts identified from the literature that relate to medical students’ self-regulation of learning in a blended learning environment
Supplemental material