
Figures & data
Table 1. Sociodemographic characteristics of the survey participants.
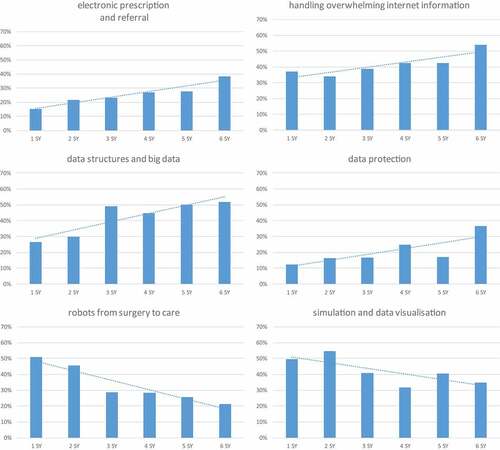
Figure 1. Trend line analysis for curriculum recommendations per study year.
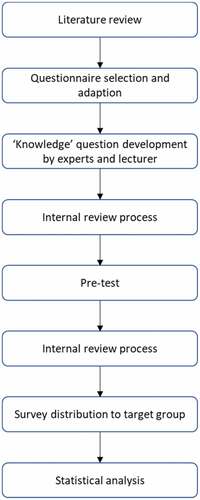
Appendix Figure A1: questionnaire design process.
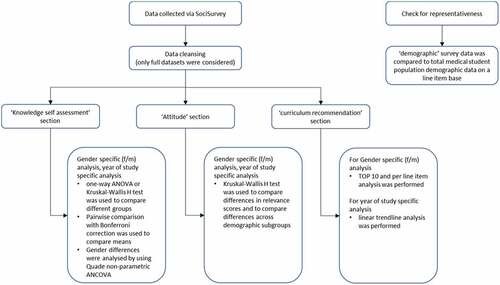
Appendix Figure A2: data analysis process.
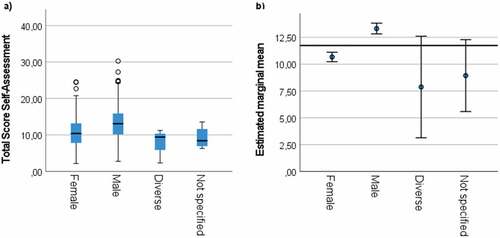
Appendix Figure A3: a) Student self-assessment score per gender, b) Estimated marginal means per gender after controlling for age group, study year, ‘previous study or vocational training’ and educational background. Whiskers in b) indicate marginal mean ± 2x standard error. Note the different y-axis range between a) and b).
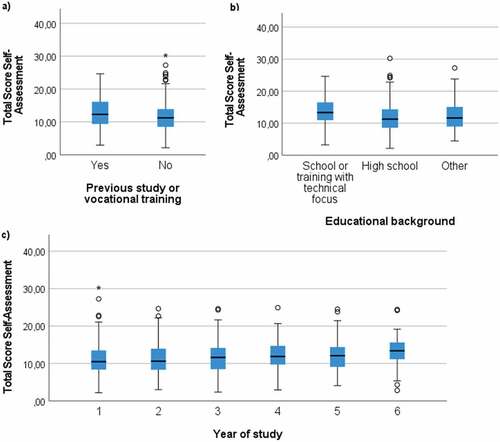
Appendix Figure A4: Student self-assessment score per a) ‘previous study or vocational training’, b) educational background and c) year of study.
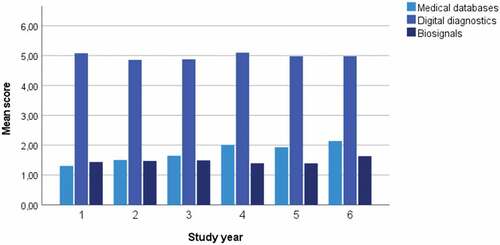
Appendix Figure A5: Student self-assessment score per topic area per study year.
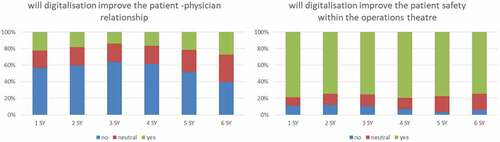
Appendix Figure A6: Attitudes towards impact of digitalization per study year.
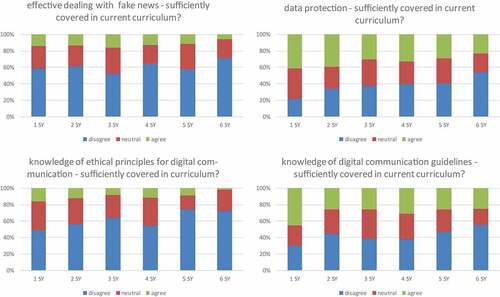
Appendix Figure A7: Satisfaction with digital communication trainings per study year.
Data availability statement
The authors confirm that the data supporting the findings of this study are available within its supplementary materials.