
Figures & data
Table 1. Comparison of Hirsch et al. (Citation2011) PARC youth development model with examples of SMA key program elements.
Figure 1. Science minors presenting to friends and family on “family day.”
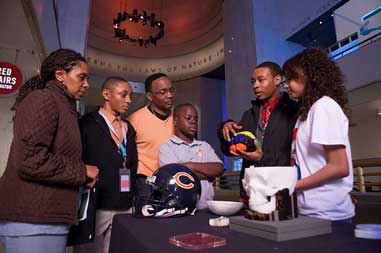
Table 2. Alumni responses to attitude toward science items (1 = Strongly Disagree, 5 = Strongly Agree).
Table 3. Alumni responses to hybridity scale (1 = Less, 10 = More).
Table 4. Analysis of variance (ANOVA) of attitude toward science scores between groups.
Figure 2. STEM career interest by gender.
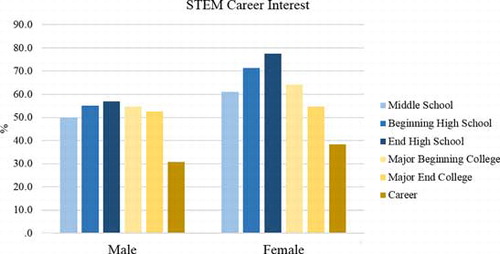
Table 5. Characterization of participant-staff relationships.
Supplemental material