
Figures & data
Figure 1. Schematic of the “Taphonomy: Dead and Fossilized” board game and associated material, i.e., cards, GPS trackers, tokens, game board, game pieces, and organisms.
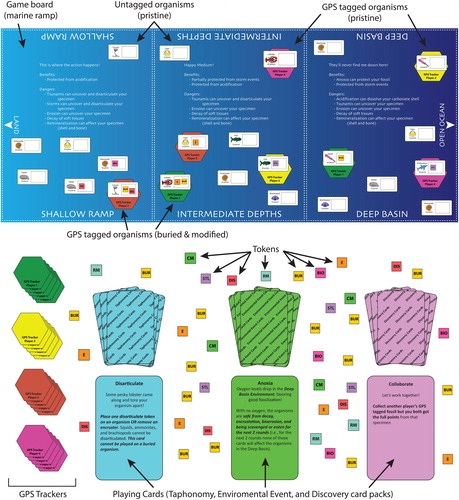
Figure 2. Photographs of Ya Ha Tinda Lagerstätte fossils with their associated game tokens.
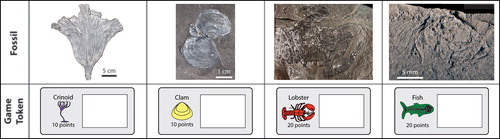
Figure 3. Summary of the test population demographics; full demographic breakdown of all 760 participants listed in the supplemental data. School Type: 76.7% Public or State Universities, 16.6% Private Universities, 4.1% two-year community colleges (2 yr CC), and 1.8% Liberal Arts colleges (LA). Gender: 53.0% female students, 43.9% male students, 0.7% non-binary students (NB), and 2.4% other/prefer not to say (NR). Major: 45.9% non-STEM majors, 42.9% STEM majors, 4.5% undeclared majors (UD), and 6.7% were not undergraduates (N/A); 24.5% were geoscience majors and 64.3% were non geoscience majors. College Year: 14.5% Freshmen (first year), 36.4% Sophomore (second year), 26.1% Junior (third year), and 18.4% Senior (fourth year or higher) students; 4.6% reported being a nontraditional student or not an undergraduate (non-Trad.). Race: 52.1% White, 18.5% Asian, 5.2% Black (Blk), 1.3% American Indian or Alaskan Native (AI), 2.1% Hawaiian or Pacific Islander (H), and 20.8% did not report their race. Ethnicity: 62.5% of students are not Hispanic, 27.5% of students are Hispanic or Latinx, and 10.0% did not report their ethnicity. LGBTQ+: 9.7% identify as LGBTQ+ (lesbian, gay, bisexual, transgender, queer and others), 85.7% did not, and 4.6% preferred not to say (NR).
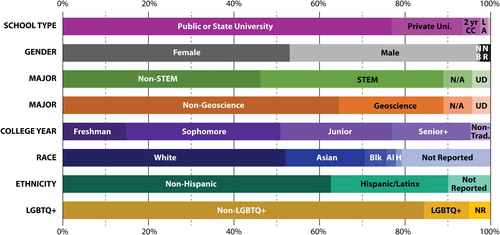
Figure 4. Diverging bar charts of student survey data with a focus on focuses on the players’ opinions of “Taphonomy: Dead and Fossilized” as an educational board game.
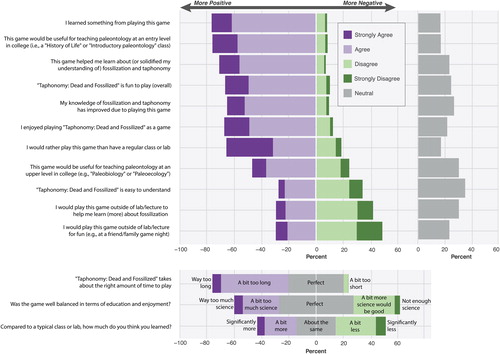
Figure 5. Diverging bar charts of student survey data with a focus on the knowledge assessments of game players following game play. Question numbers (i.e., C1-C12) correspond to the survey results in supplementary data.
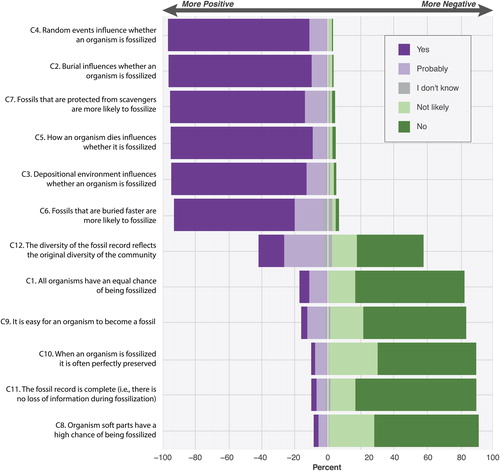
Figure 6. Diverging bar charts of teacher survey data, including both professors and teaching assistants. Specifically, the teachers’ opinions of “Taphonomy: Dead and Fossilized” as a board game and educational tool.
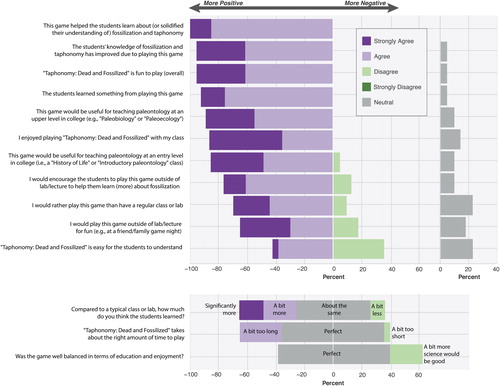
Table 1. Student comments about the game and educational gains, see supplementary data for a complete list of student comments.
Table 2. Teacher (professor and teaching assistant) comments about the game, see supplementary data for a complete list of teacher comments.
Table 3. Standardized residual results for Question B1: “Taphonomy: Dead and Fossilized is fun to play (overall).” Positive values indicate positive association, negative values indicate negative association; merged cells indicate combined groups of similar responses that were analyzed together (e.g., strongly agree + agree versus disagree + strongly disagree).
Table 4. Standardized residual results for Question B6: “My knowledge of fossilization and taphonomy has improved due to playing this game.” Positive values indicate positive association, negative values indicate negative association.
Table 5. Standardized residual results for Question A3: “Compared to a typical class or lab, how much do you think you learned?.” Positive values indicate positive association, negative values indicate negative association.
Table 6. Standardized residual results for Question B11: “This game would be useful for teaching paleo at an entry level at a college or university.” Positive values indicate positive association, negative values indicate negative association; merged cells indicate combined groups of similar responses that were analyzed together.
Table 7. Standardized residual results for Question B12: “This game would be useful for teaching paleo at an upper level at a college or university.” Positive values indicate positive association, negative values indicate negative association.
Table 8. Standardized residual results for Question A2: “Was the game well balanced in terms of education and enjoyment?.” Positive values indicate positive association, negative values indicate negative association.
Table 9. Standardized residual results for Question B3: ““Taphonomy: Dead and Fossilized” is easy to understand.” Positive values indicate positive association, negative values indicate negative association; merged cells indicate combined groups of similar responses that were analyzed together.