
Figures & data
Table 1. Institutional data of participating colleges/universities.
Figure 1. Percentages of sample who had identified majors within eight categories of disciplines.
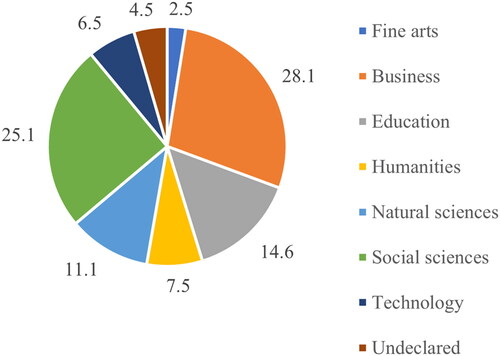
Table 2. Percentages of sample’s reported racial, ethnicity, and Latinx identities (non-mutually exclusive).
Figure 2. Comparison of responses on each item of the pre/post-module assessment, indicating number of students who answered correctly pre- and post-module (yellow), incorrectly pre-module and correctly post-module (gray, indicative of desirable learning gains), correctly pre-module and incorrectly post-module (orange, indicative of regressed change), and incorrectly pre- and post-module (blue, indicative of new measurable learning). Parenthetical notation indicates whether the item measured statistical concept understanding (S), climate change understanding (C), or both (S, C).
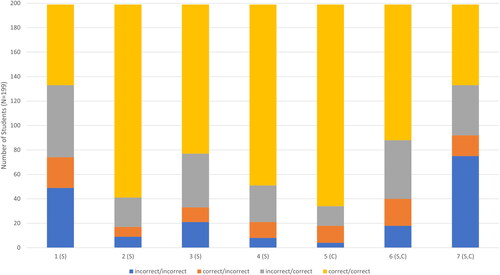
Table 3. Results of McNemar’s test comparing participants’ responses to pre- and post-module assessments of understanding of statistical concepts (S) and understanding of climate change (C).
Figure 3. Participants’ climate change anxiety measured at the beginning of the course, prior to the module, and after the module; asterisks indicate statistically significant difference. Error bars indicate standard deviation.
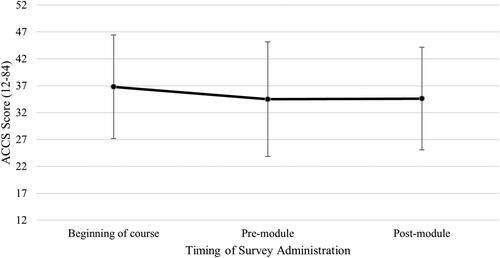
Table 4. Number of students who accepted the scientific consensus or held one of two dissenting views about climate change across three timepoints throughout the course.
Table 5. Descriptors of persistent climate science dissenters (N = 4) and their climate change anxiety at the end of the course (number of SDs from the mean).