Figures & data
Figure 1. Schematic representation of the stages of community development, as described by Wenger et al. (Citation2002). Figure modified from Wenger et al. (Citation2002), Figure 4-1, p. 69.
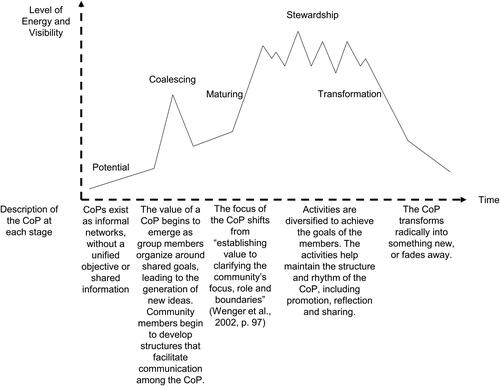
Figure 2. Percent of respondents identifying with different geoscience subdisciplines. Geology and atmospheric science subdisciplines are grouped together. Note: respondents could choose multiple subdisciplines.
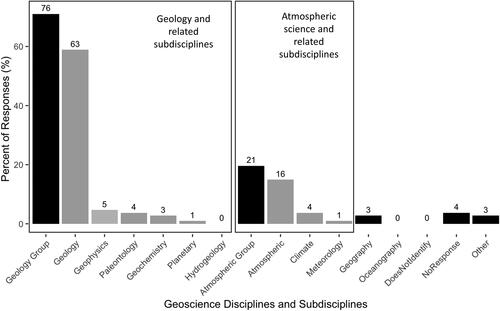
Figure 3. Percent of respondents identifying different learning-related professional development opportunities requested by the community.
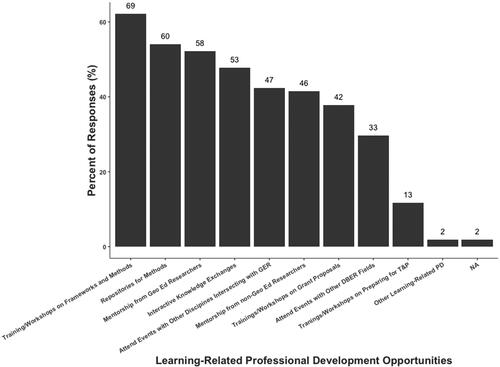
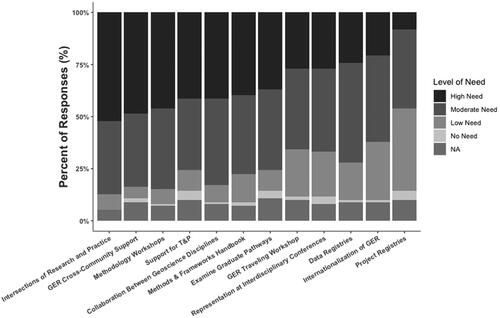
Figure 4. Number of survey respondents identifying different community needs as high, moderate, low, no need, or N/A. For the full text of items represented by each bar, please see question 5 in the Supplemental File.