
Figures & data
Figure 1. Classification of Fiber metal laminates based on metal alloys (Sinmazçelik et al., Citation2011). (adapted and modified).
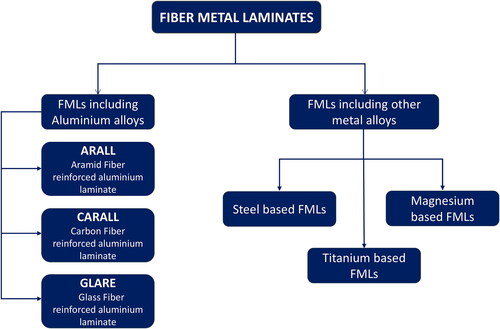
Figure 2. (a) schematic representation of specimen preparation using vacuum bagging method and (b) schematic of an alternate layer of Ti sheets and carbon fiber prepregs.
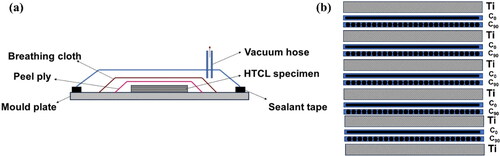
Figure 3. (a) curing cycle of the HTCL specimen and (b) Fabricated HTCL specimen.
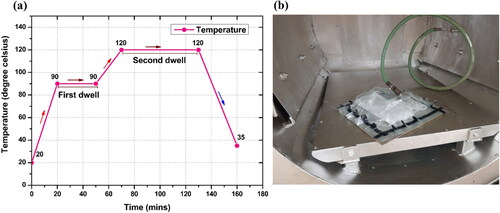
Figure 4. Image of experimental setup indicating two machining conditions: (a) Cryogenic machining and (b) Dry machining and instruments for various response measurements.
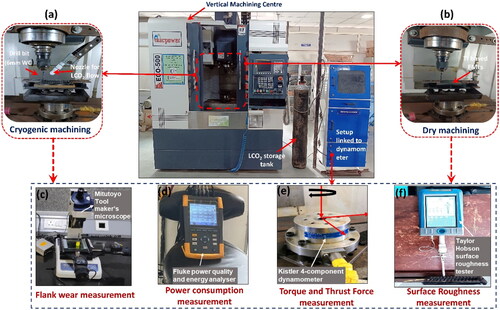
Table 1. Details about machine tool and cutting tool.
Figure 5. Thrust force profile during drilling of HTCL in (a) dry, (b) cryogenic conditions.
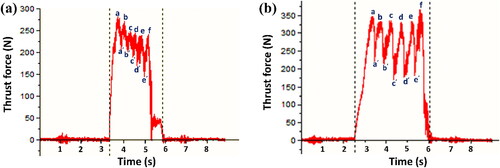
Figure 6. (a) Torque and (b) thrust force variation under dry and cryogenic machining conditions.
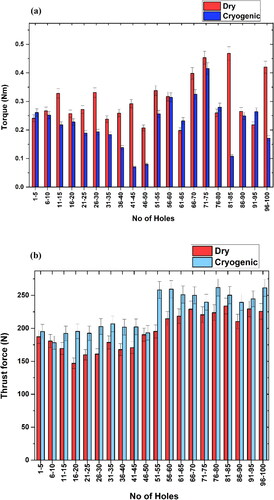
Figure 7. Surface roughness measurement for dry and cryogenic machining under same cutting parameters (a) surface roughness (μm) comparison for both machining conditions, (b) measurement of surface roughness of holes through surface roughness tester, and (c) tangled Ti chips around the drill bit during dry machining.
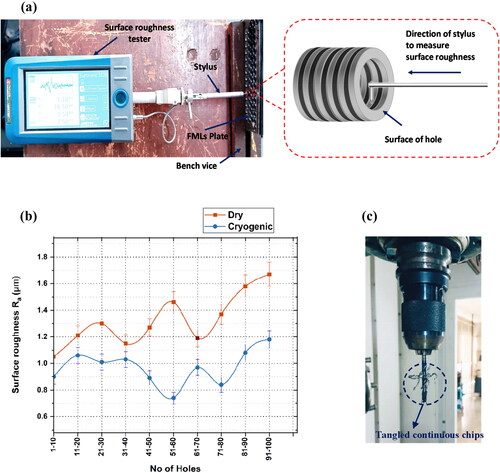
Figure 8. Flank wear progression for (a) cryogenic machining, (b) dry machining, and (c) Dry vs. Cryogenic comparison with respect to the number of holes drilled.
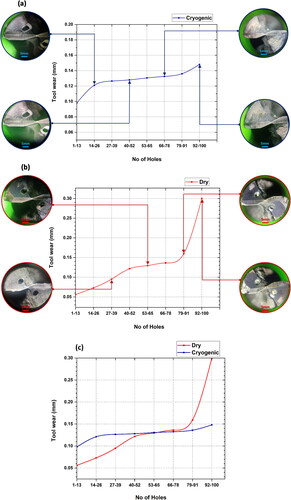
Figure 9. Flank wear images of drill bits for the dry and cryogenic environments, where (1) corner wear, (2) chemical reactivity due to Ti6Al4V on the tool, (3) BUE on the corner, (4) abrasion, and (5) catastrophic failure.
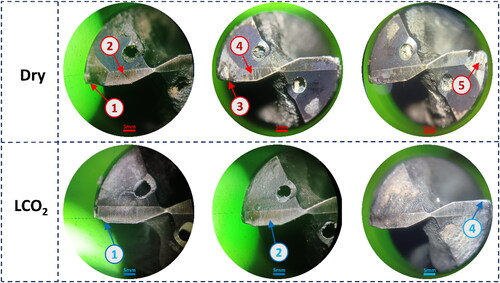
Figure 10. Chips formed during drilling in (a) dry conditions and (b) cryogenic condition.
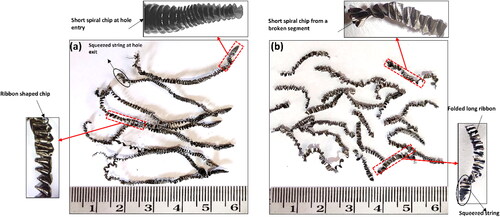
Figure 11. comparison of (a) power consumption and (b) specific cutting energy while drilling HTCL during dry and cryogenic environments.
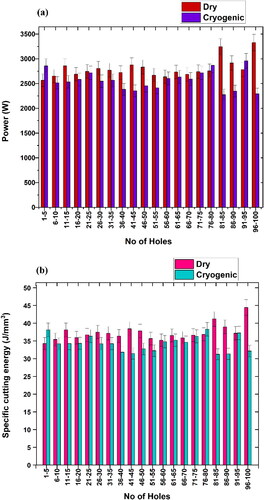
Figure 12. An illustration showing the LCA steps and system boundaries with the processes involved.
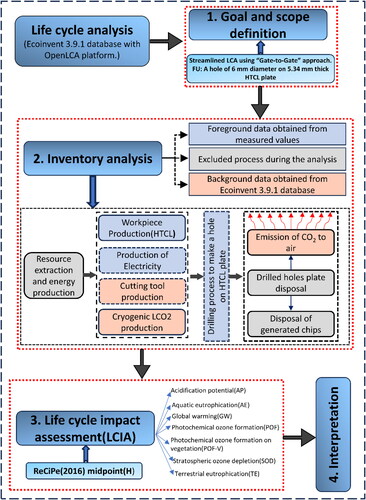
Table 2. Details of Life cycle inventory.
Table 3. Database to produce 1 unit of solid carbide drill bit (Maheshwari et al., Citation2023).
Table 4. Database for production of one HTCL workpiece sample.
Table 5. Data sources for LCI.
Figure 13. Comparison of dry and cryogenic conditions based on their impacts on the environment.
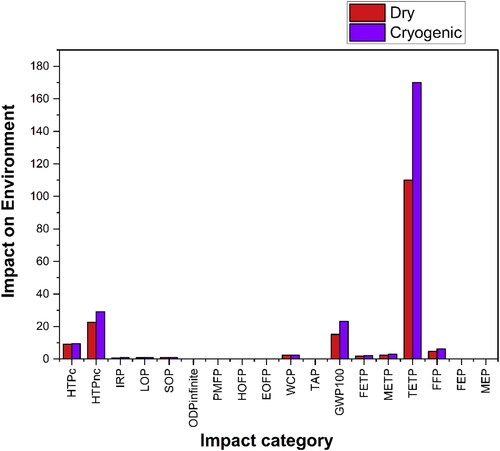
Figure 14. Relative indicator results of the respective project variants for dry and cryogenic machining.
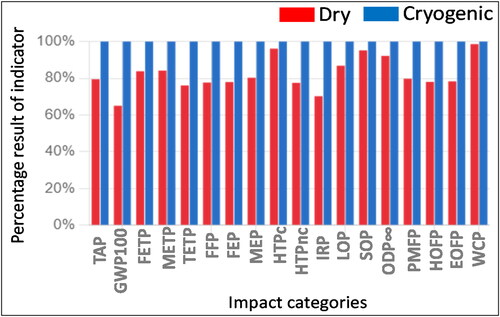
Figure 15. Radar diagram showing the impacts on the environment in various categories.
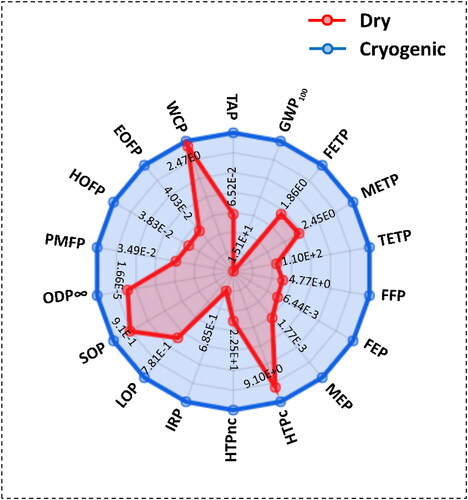
Table 6. Impact assessment results of various categories under both cutting conditions.