
Figures & data
TABLE 1 Schematic Representation of an Input–Output Transaction Table (Miller and Blair Citation2009)
TABLE 2 Analyzed Cyberattack Scenarios Classified According to the Computer and Network Incident Taxonomy
TABLE 3 Summary of the Scenarios and the Respective Input Parameters for the Input–Output Analysis
TABLE 4 Top 10 Affected Sectors Based on Average Inoperability
FIGURE 1. Inoperability Development of the Top 10 Inoperable Sectors.
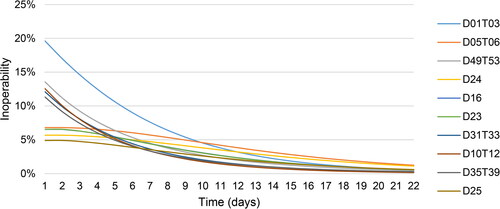
FIGURE 2. Cumulative Economic Losses for the Top 10 Affected Sectors.
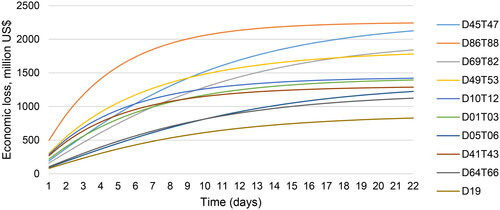
FIGURE 3. Dynamic Cross-Prioritization Plot.
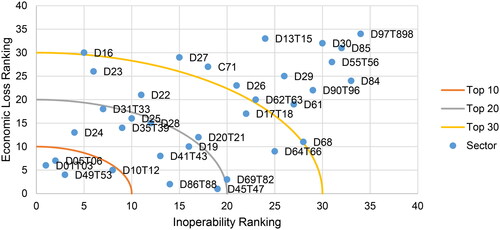
TABLE 5 Summary of Total Economic Losses by Scenario
Supplemental material