Figures & data
Table 1. Demographic characteristics of the research sample.
Figure 1. A school subject (“Mathematics”) in varying distances and sizes.
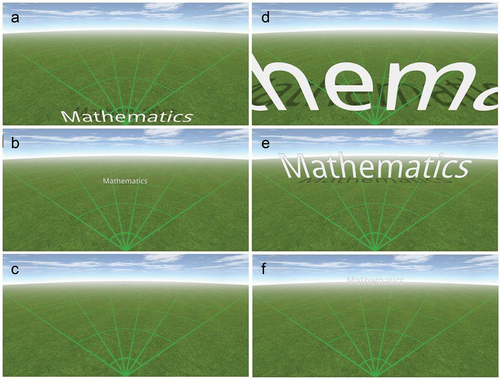
Table 2. Examples of statements and first- and second-order categories derive from them.
Table 3. Themes and their occurrence in response to the metaphor of Distance.
Table 4. Themes and their occurrence in response to the metaphor of Size.
Figure 2. Graphical output of the research software.
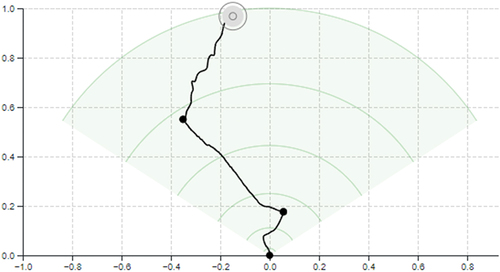
Table 5. Inter-rater reliability for each theme and metaphor.
Figure 3. Relative frequencies of themes related to Distance for each school subject.
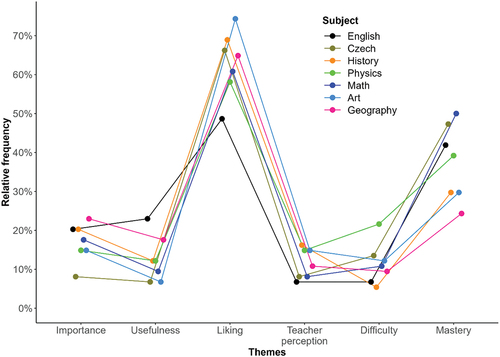
Figure 4. Relative frequencies of themes related to Size for each school subject.
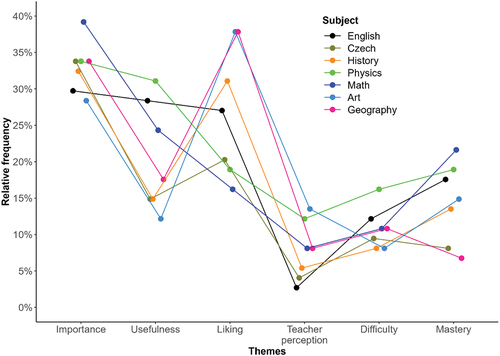
Table 6. Analysis of the metaphors’ propensity to elicit different themes using logistic regression.
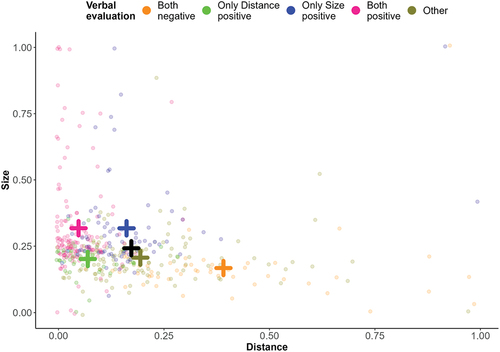
Figure 5. The relation between verbal evaluation and the values of Size and Distance.
Figure 6. Scatterplot of Distance and Size values with color based on verbal evaluation.