
Figures & data
Table 1. Participation rates for the CRIES survey presented by school location and school level.
Figure 1. Distribution of students’ CRIES total scores: Comparisons by school level and school location.
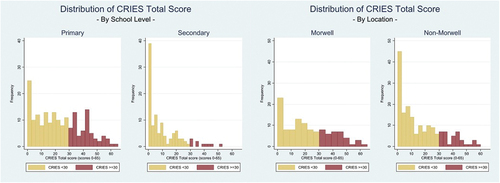
Table 2. CRIES outcomes: Comparisons of students by school location.
Table 3. CRIES outcomes: Comparison of students by school level.