5,837
Views
46
CrossRef citations to date
0
Altmetric
Reviews

Increased blood levels of persistent organic pollutants (POP) in obese individuals after weight loss—A review

, , , &

Figures & data

Figure 1. Flow diagram showing literature selection strategy.

Figure 1. Flow diagram showing literature selection strategy.

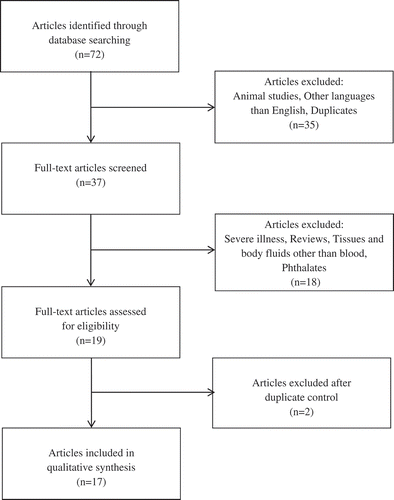
Table 1. Reported data from the 17 identified studies.

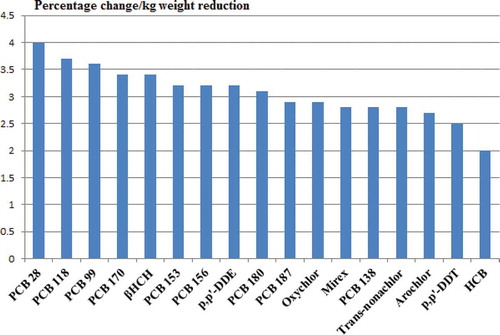
Table 2. Percentage change of POP concentrations per kilogram weight reduction with average change, calculated from the individual five selected studies (average change in declining order).

Figure 2. Percentage change in blood concentration of POP per kilogram weight reduction in declining order.

Figure 2. Percentage change in blood concentration of POP per kilogram weight reduction in declining order.
Supplemental material

Table 2: Reported data and detailed calculations from the 5 selected studies

Download MS Word (31.8 KB)

Table 1: Reported data and detailed calculations from the two studies reporting on BDE and OH-CBs

Download MS Word (17.6 KB)