2,067
Views
19
CrossRef citations to date
0
Altmetric
Original Articles

Measurement of Optical Properties of Foods in Near- and Mid-Infrared Radiation

, &
Pages 651-664 | Received 21 Jul 2005, Accepted 19 Nov 2005, Published online: 18 Apr 2007

Figures & data

Figure 3 Spectral emissive powers (blackbody radiation) of ceramic tube (1293 K) and halogen lamp (2212 K) emitters at their typical temperatures with the detector ranges for Si and PbS super-imposed.
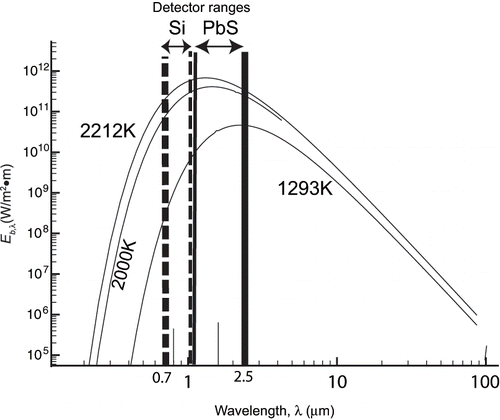
Figure 3 Spectral emissive powers (blackbody radiation) of ceramic tube (1293 K) and halogen lamp (2212 K) emitters at their typical temperatures with the detector ranges for Si and PbS super-imposed.

Figure 1Schematic illustrating the radiation interchange for a food layer of thickness s. I is the incident radiation, R is the reflected radiation, and T is the transmitted radiation. The energy crossing the food surface is I–R.
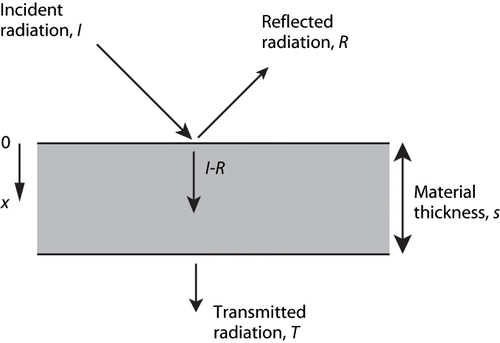
Figure 1Schematic illustrating the radiation interchange for a food layer of thickness s. I is the incident radiation, R is the reflected radiation, and T is the transmitted radiation. The energy crossing the food surface is I–R.

Figure 2 Spectroradiometer system layout for diffuse reflectance and transmittance measurements.[Citation20]

Figure 2 Spectroradiometer system layout for diffuse reflectance and transmittance measurements.[Citation20]

Figure 4 Spectral hemispherical reflectance, ρ, and transmittance, τ. Reflectance shows little variation between 1 and 3 cm thickness.
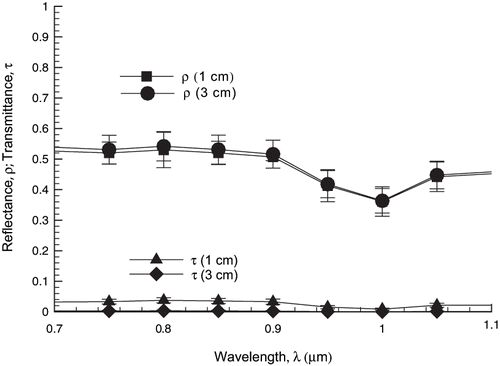
Figure 4 Spectral hemispherical reflectance, ρ, and transmittance, τ. Reflectance shows little variation between 1 and 3 cm thickness.

Figure 5 Variation of spectral hemispherical reflectance, ρ, of potato tissue with different heat treatments (raw and heated in water for 5 and 10 minutes, respectively), showing the largest variation occurring between raw and heated samples.
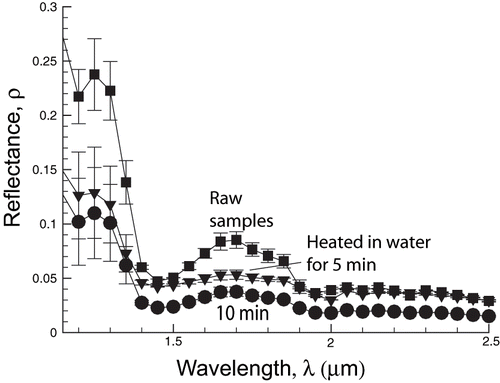
Figure 5 Variation of spectral hemispherical reflectance, ρ, of potato tissue with different heat treatments (raw and heated in water for 5 and 10 minutes, respectively), showing the largest variation occurring between raw and heated samples.

Figure 6 Pictures of (a) raw potato sample, (b) same potato sample after 10 minutes of cooking in boiling water, and (c) an enlargement (three times) of detail in (b). Pictures taken with Metallurgical microscope, Model ML-MET (Meiji Labax Co. Ltd, Tokyo, Japan).
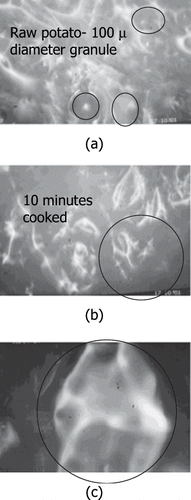
Figure 6 Pictures of (a) raw potato sample, (b) same potato sample after 10 minutes of cooking in boiling water, and (c) an enlargement (three times) of detail in (b). Pictures taken with Metallurgical microscope, Model ML-MET (Meiji Labax Co. Ltd, Tokyo, Japan).

Figure 7 Transmittance, τ, for various thicknesses of potato tissue illustrated for 82 ± 2% moisture content. Lines are fitted through data points using EquationEq. 2. The R 2 values ranged from 0.862 to 0.996 for various wavelengths and moisture contents.
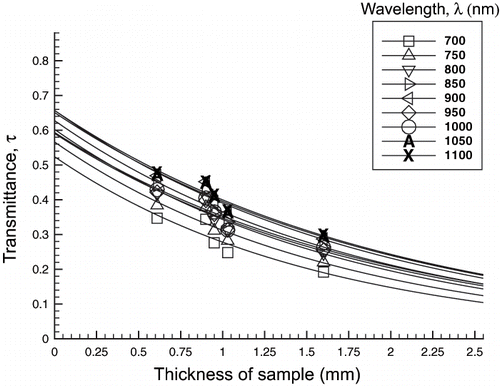
Figure 7 Transmittance, τ, for various thicknesses of potato tissue illustrated for 82 ± 2% moisture content. Lines are fitted through data points using EquationEq. 2. The R 2 values ranged from 0.862 to 0.996 for various wavelengths and moisture contents.

Figure 8 Spectral hemispherical reflectance, ρ, in potato tissue at various moisture contents (shown in percentages with associated error). Samples are of 1 cm thickness.
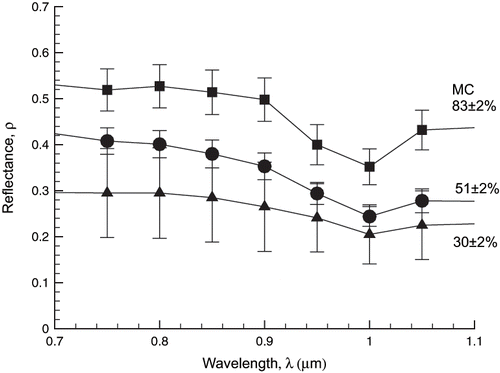
Figure 8 Spectral hemispherical reflectance, ρ, in potato tissue at various moisture contents (shown in percentages with associated error). Samples are of 1 cm thickness.

Figure 9 Spectral absorptance for potato tissue at 51% moisture content, 1 cm thickness, calculated using α = 1 – ρ   – τ.
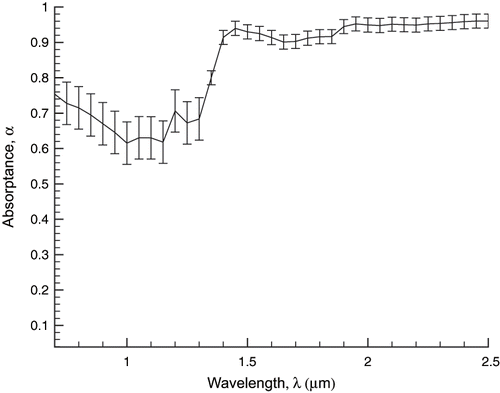
Figure 9 Spectral absorptance for potato tissue at 51% moisture content, 1 cm thickness, calculated using α = 1 – ρ   – τ.

Figure 10 Spectral hemispherical transmittance, τ, for raw potato tissue at 86% moisture content and 1 cm thickness.
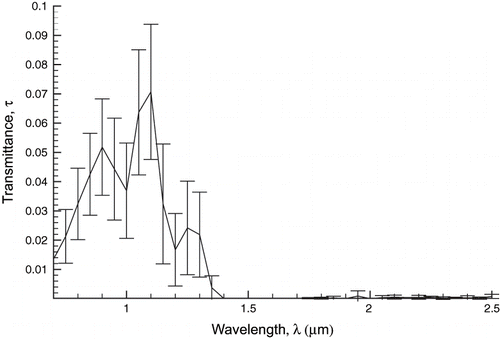
Figure 10 Spectral hemispherical transmittance, τ, for raw potato tissue at 86% moisture content and 1 cm thickness.

Figure 11 Spectral variation of penetration depth, δ, for potato tissue at various moisture contents (shown in percentage). Penetration depth is calculated as noted in .
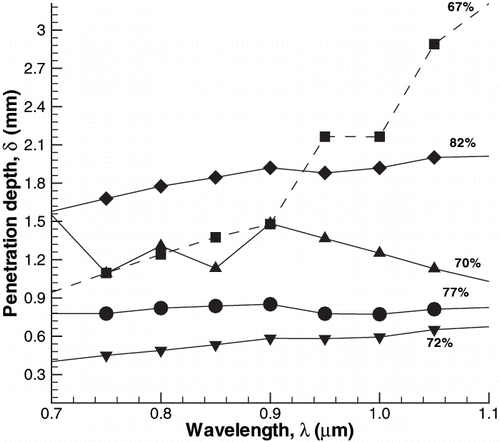
Figure 11 Spectral variation of penetration depth, δ, for potato tissue at various moisture contents (shown in percentage). Penetration depth is calculated as noted in Fig. 7.

Figure 12 Variation of penetration depth, δ, for potato tissue with moisture content, replotted from the data in by averaging data for all wavelengths at a given moisture content. The error bars denote the range of data over all wavelengths at a given moisture content in .
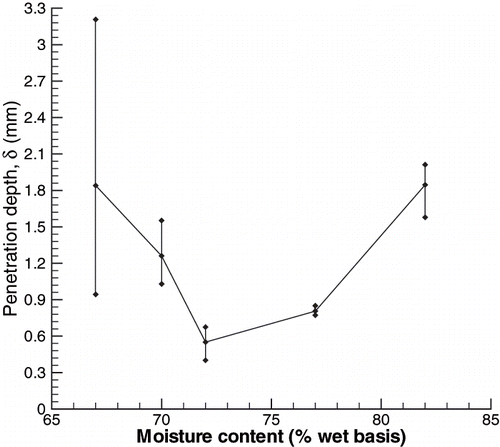
Figure 12 Variation of penetration depth, δ, for potato tissue with moisture content, replotted from the data in Fig. 11 by averaging data for all wavelengths at a given moisture content. The error bars denote the range of data over all wavelengths at a given moisture content in Fig. 11.

Reprints and Corporate Permissions

Please note: Selecting permissions does not provide access to the full text of the article, please see our help page How do I view content?

To request a reprint or corporate permissions for this article, please click on the relevant link below:

Academic Permissions

Please note: Selecting permissions does not provide access to the full text of the article, please see our help page How do I view content?

Obtain permissions instantly via Rightslink by clicking on the button below:

If you are unable to obtain permissions via Rightslink, please complete and submit this Permissions form. For more information, please visit our Permissions help page.