4,741
Views
28
CrossRef citations to date
0
Altmetric
Original Articles

Infrared and Fluorescence Spectroscopic Techniques for the Determination of Nutritional Constituents in Foods

, , &
Pages 299-320 | Received 03 Jun 2006, Accepted 26 Aug 2006, Published online: 27 Apr 2007

Figures & data

Figure 1 Fluorescence and infrared spectroscopies for the investigation of dilute solution and food products.
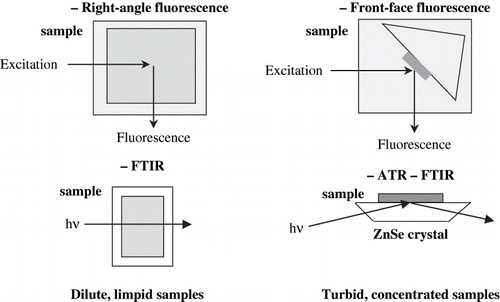
Figure 1 Fluorescence and infrared spectroscopies for the investigation of dilute solution and food products.

Figure 2 Normalised fluorescence spectra of tryptophan recorded following excitation at 290 nm on central M1 zone (—), external M1 zone (…), central M3 zone (− − −), and external M3 zone (−··−··−) cheeses.
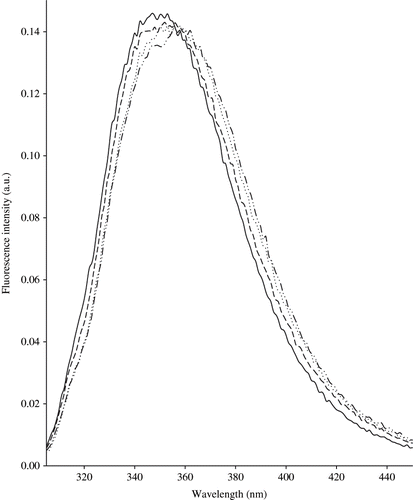
Figure 2 Normalised fluorescence spectra of tryptophan recorded following excitation at 290 nm on central M1 zone (—), external M1 zone (…), central M3 zone (− − −), and external M3 zone (−··−··−) cheeses.
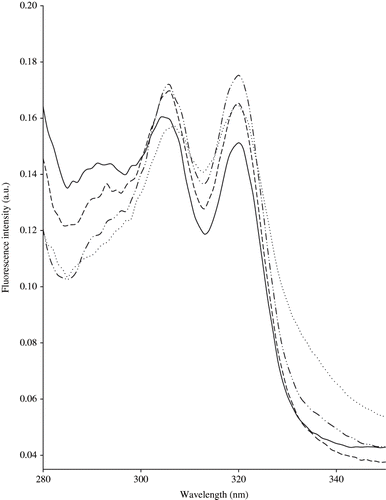
Figure 3 Normalised fluorescence spectra of vitamin A recorded following emission at 410 nm on central M1 zone (—), external M1 zone (…), central M3 zone (− − −), and external M3 zone (−··−··−) cheeses.
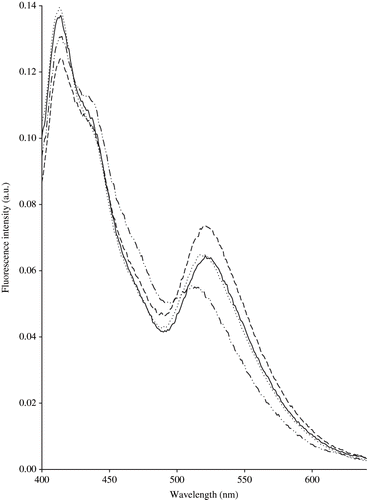
Figure 3 Normalised fluorescence spectra of vitamin A recorded following emission at 410 nm on central M1 zone (—), external M1 zone (…), central M3 zone (− − −), and external M3 zone (−··−··−) cheeses.

Figure 4 Normalised fluorescence spectra of riboflavin recorded following excitation at 380 nm on central M1 zone (—), external M1 zone (…), central M3 zone (− − −), and external M3 zone (−··−··−) cheeses.

Figure 4 Normalised fluorescence spectra of riboflavin recorded following excitation at 380 nm on central M1 zone (—), external M1 zone (…), central M3 zone (− − −), and external M3 zone (−··−··−) cheeses.

Figure 5 Averaged near-infrared spectra for Emmental cheeses from Switzerland (—), Austria (…), and Finland (− − −).
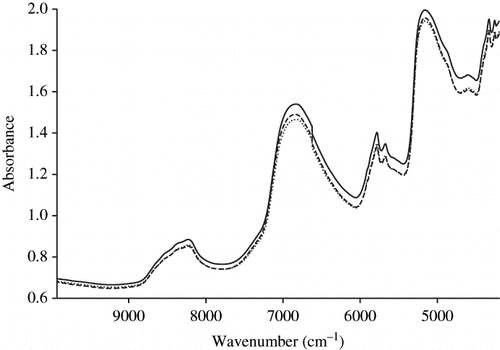
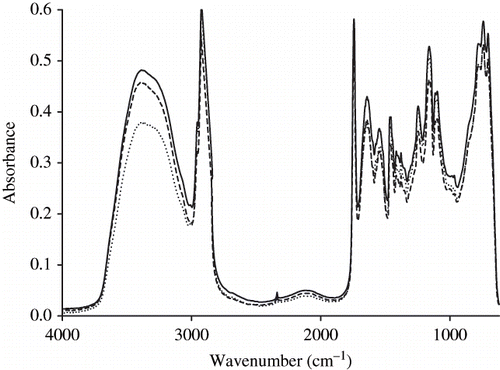
Figure 5 Averaged near-infrared spectra for Emmental cheeses from Switzerland (—), Austria (…), and Finland (− − −).
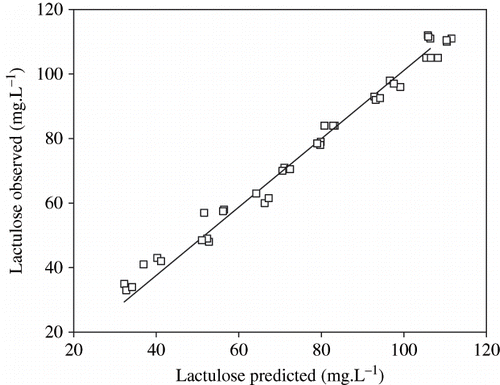
Figure 6 Averaged mid-infrared spectra for Emmental cheeses from Switzerland (—), Austria (…), and Finland (− − −).

Figure 6 Averaged mid-infrared spectra for Emmental cheeses from Switzerland (—), Austria (…), and Finland (− − −).

Figure 7 Prediction of lactulose content in UHT milk samples from fluorescence spectra and comparison with observed values determined by the enzymatic method.

Figure 7 Prediction of lactulose content in UHT milk samples from fluorescence spectra and comparison with observed values determined by the enzymatic method.

Reprints and Corporate Permissions

Please note: Selecting permissions does not provide access to the full text of the article, please see our help page How do I view content?

To request a reprint or corporate permissions for this article, please click on the relevant link below:

Academic Permissions

Please note: Selecting permissions does not provide access to the full text of the article, please see our help page How do I view content?

Obtain permissions instantly via Rightslink by clicking on the button below:

If you are unable to obtain permissions via Rightslink, please complete and submit this Permissions form. For more information, please visit our Permissions help page.