Figures & data
Figure 1 Main trends in the behaviour of protein/polysaccharide mixtures (modified from de Kruif and Tuinier[Citation13]).
![Figure 1 Main trends in the behaviour of protein/polysaccharide mixtures (modified from de Kruif and Tuinier[Citation13]).](/cms/asset/7ba197dd-c496-4481-943f-7a91dc947313/ljfp_a_322507_o_f0001g.gif)
Figure 2 Examples of jelly products a) Jelly snakes, b) Jelly babies, c) Jelly frogs.
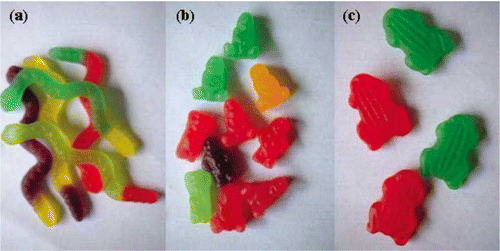
Figure 3 Chemical Structure of a) amylose and b) amylopectin.
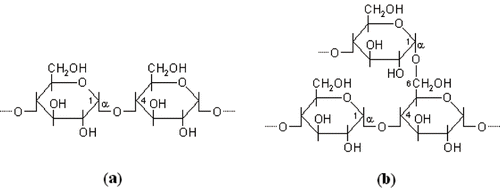
Figure 4 The starch gelatinization mechanism. a) Starch granules; b) Swelling of granules upon application of heat and moisture; c) Leaching of amylose; and d) Creation of starch gel matrix (modified from Remsen and Clark[Citation52]).
![Figure 4 The starch gelatinization mechanism. a) Starch granules; b) Swelling of granules upon application of heat and moisture; c) Leaching of amylose; and d) Creation of starch gel matrix (modified from Remsen and Clark[Citation52]).](/cms/asset/84db35b0-ae26-49e6-8343-05c1bcb3ebec/ljfp_a_322507_o_f0004g.gif)
Figure 5 A typical gelatin amino acid composition.
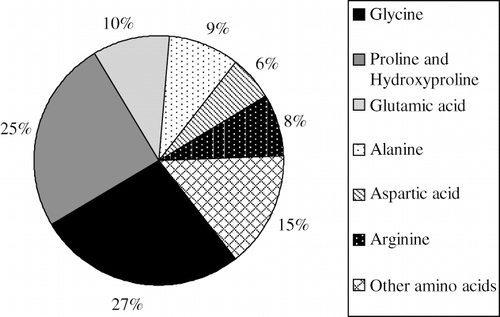
Figure 6 Sol-gel transition in a gelatin system.
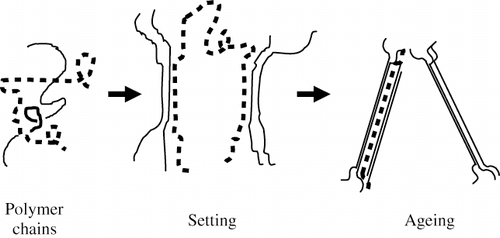
Figure 7 Pectin chemical structure.
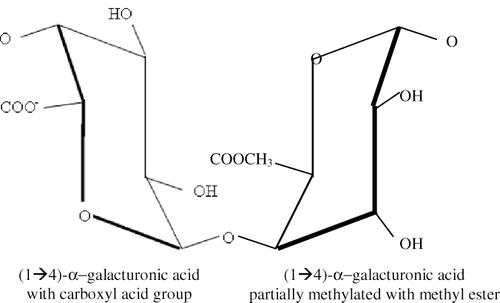
Figure 8 Schematic of confectionery gel process (modifed from Edwards[Citation3]).
![Figure 8 Schematic of confectionery gel process (modifed from Edwards[Citation3]).](/cms/asset/96591011-8f1c-42ed-9c56-380cfcaec54f/ljfp_a_322507_o_f0008g.gif)
Figure 9 Schematic of an extruder.
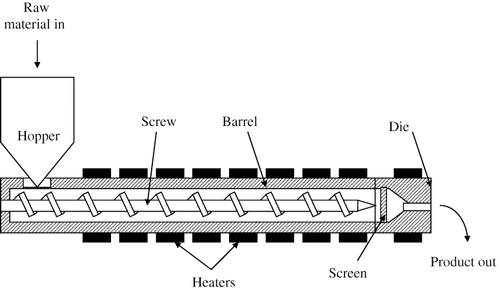
Figure 10 Structure models of three jelly pastille products (modified from Groves 2003 [Citation28]).
![Figure 10 Structure models of three jelly pastille products (modified from Groves 2003 [Citation28]).](/cms/asset/5a0118d7-140a-488f-b4a5-37481ec9957c/ljfp_a_322507_o_f0010g.gif)
Figure 11 TEM micrographs of four different commercial confectionery gels showing a) a starch/sugar-rich matrix enclosing gelatin-rich inclusions; b-c) a bicontinuous structure d) a gelatin-rich matrix enclosing starch/sugar-rich inclusions (scale bars all 2μm) from Burey[Citation122].
![Figure 11 TEM micrographs of four different commercial confectionery gels showing a) a starch/sugar-rich matrix enclosing gelatin-rich inclusions; b-c) a bicontinuous structure d) a gelatin-rich matrix enclosing starch/sugar-rich inclusions (scale bars all 2μm) from Burey[Citation122].](/cms/asset/e83c804a-17de-4633-8e16-e34b07f6528f/ljfp_a_322507_o_f0011g.gif)
Figure 12 The three stages during deformation testing. Stage 1. Deformation during small deformation testing; Stage 2. deformation during intermediate deformation testing; Stage 3. Deformation during large deformation testing (modified from Olkku and Sherman[Citation137]).
![Figure 12 The three stages during deformation testing. Stage 1. Deformation during small deformation testing; Stage 2. deformation during intermediate deformation testing; Stage 3. Deformation during large deformation testing (modified from Olkku and Sherman[Citation137]).](/cms/asset/d89e3625-a2b7-41e1-8143-cc5d3709b6df/ljfp_a_322507_o_f0012g.gif)
Figure 13 Variation of G′, G″, and tan δ as a function of temperature, frequency, molecular weight, and concentration for amorphous polymers (modified from Kasapis, Mitchell, Abeysekera and MacNaughtan[Citation23]).
![Figure 13 Variation of G′, G″, and tan δ as a function of temperature, frequency, molecular weight, and concentration for amorphous polymers (modified from Kasapis, Mitchell, Abeysekera and MacNaughtan[Citation23]).](/cms/asset/72a840c1-ae68-407a-83ff-9454b6cdaeb0/ljfp_a_322507_o_f0013g.gif)