Figures & data
Table 1 Central Composite Rotatable Design for the independent variables (actual and coded levels)
Table 2 ANOVA table showing the variables as a linear, quadratic and interaction terms on each response variable and coefficients for the prediction models
Figure 1 Response surface for WL (a), WR (b), SG (c), and shrinkage (d) during osmotic dehydration of plum as function of sucrose concentration and temperature (at constant immersion time, 150).
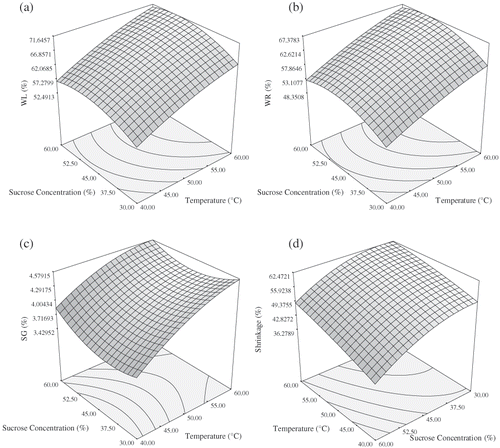
Figure 2 Response surface for WL (a), WR (b), SG (c), and shrinkage (d) during osmotic dehydration of plum as function of immersion time and temperature (at constant sugar concentration, 45 g/100 g sample).
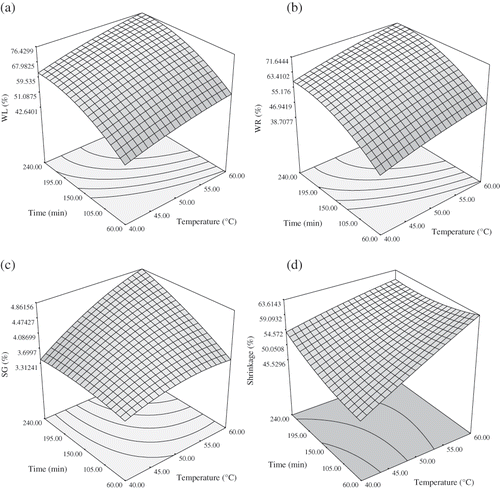
Figure 3 The optimum region by overlaying contour plots of the four responses evaluated (WL, WR, SG, and shrinkage) as function of sucrose concentration and temperature (at constant immersion time, 240 min).
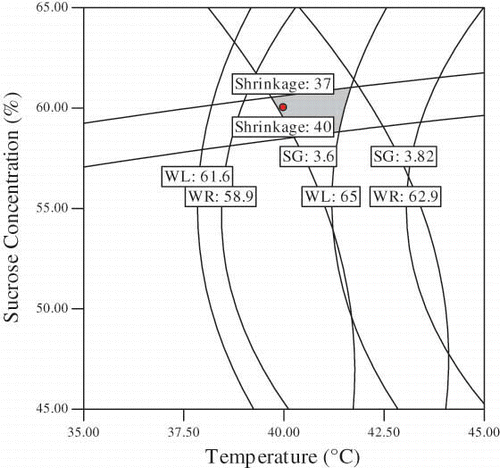
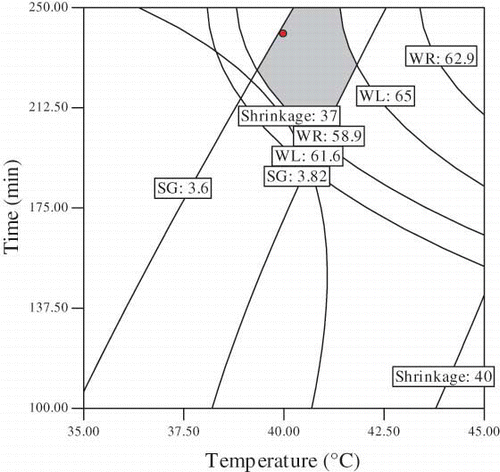
Figure 4 The optimum region by overlaying contour plots of the four responses evaluated (WL, WR, SG, and shrinkage) as function of immersion time and temperature (at constant sugar concentration, 60 g/100 g sample).