Figures & data
Table 2 Effect of various inhibitors on the trypsin activity of sierra gut enzyme extract
Figure 1 Sodium dodecyl sulfate-polyacrylamide gel electrophoresis of protease extracted from S. sierra viscera after affinity chromatography. Lane A: molecular weight standards; Lane B: S. sierra trypsin-like enzyme extract.
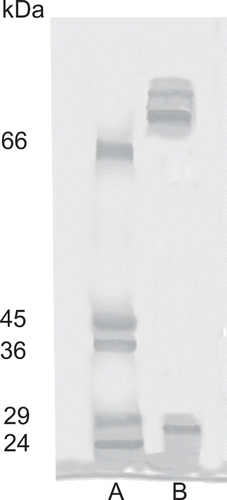
Table 1 Protein concentration, specific activity and purification level during extraction of trypsin from sierra (Scomberomorus sierra ) gut
Table 3 DH of different protein fractions from gluten of both durum and bread wheat hydrolyzed by semipurified trypsin
Table 4 Variation of isoelectric point (zero zeta potential) between native and hydrolyzed gluten particles
Figure 2 Zeta potential (electrokinetic potential) of native and hydrolyzed gluten from wheat flours. (a) durum wheat and (b) bread wheat.
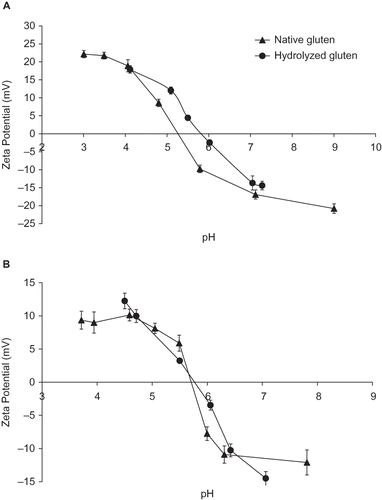
Figure 3 Gluten index in response to various enzyme doses at different incubation times. (a) Bread wheat flour and (b) durum wheat flour.
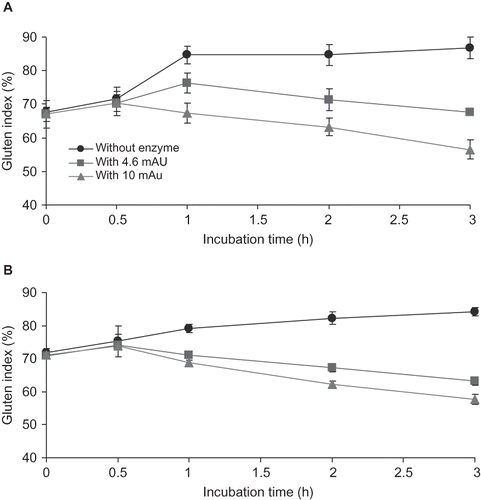
Table 5 Effect of enzyme over farinograms data of bread and durum wheat flour
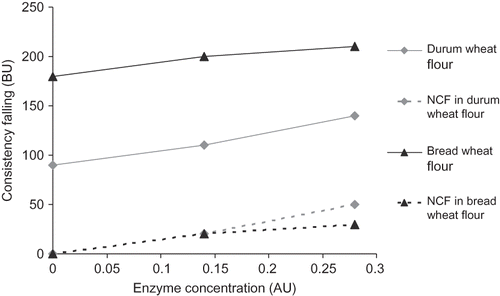
Figure 4 Effect of enzyme on consistency falling and net consistency falling (NCF) after 1.5 h of incubation.