Figures & data
Table 1 Gluten free bread formulation
Table 2 Worksheet of the central composite experimental design
Table 3 Regression equationsFootnote a coefficients and analysis of variance for the different responses.Footnote b
Figure 1 Response surface plot: effect of HPMC and water addition on loaf specific volume. sfb: starch/flour base.
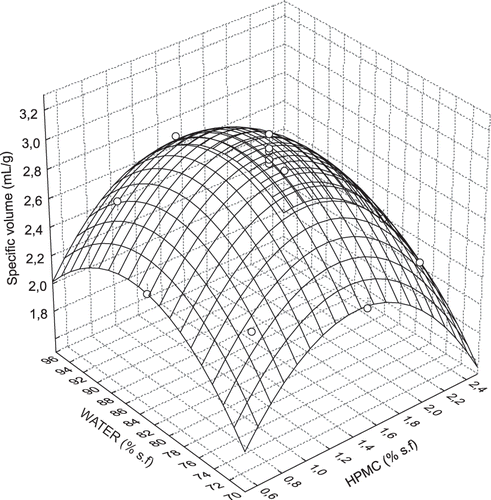
Figure 2 Response surface plot: effect of HPMC and water addition on crumb firmness. sfb: starch/flour base.
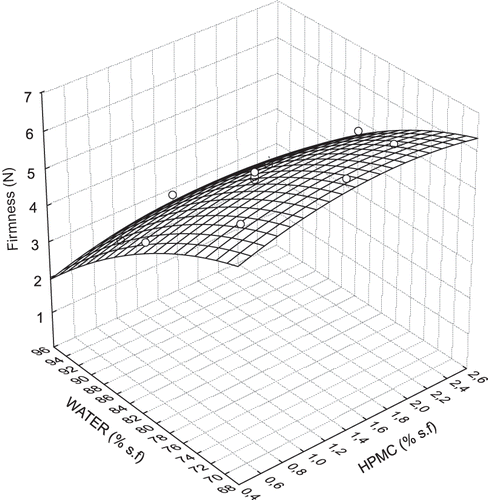
Figure 3 Response surface plot: effect of HPMC and water addition on crumb L value. sfb: starch/flour base.
Table 4 Predicted and observed data for the responses at optimum conditions
Figure 4 Effect of storage on crumb firmness of the optimized gluten free bread. Mean values ± standard deviation of 3 replicates; Values followed by different letters in the same column are significantly different (P < 0.05).
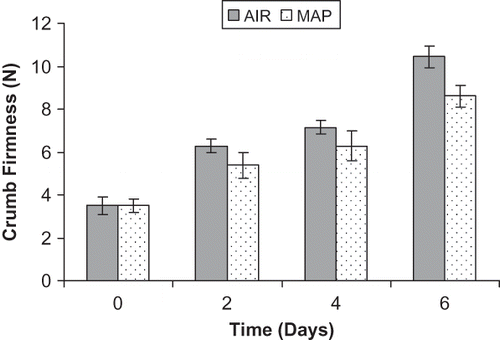
Figure 5 Effect of storage on crumb moisture of the optimized gluten free bread. Mean values ± standard deviation of 3 replicates; Values followed by different letters in the same column are significantly different (P < 0.05).
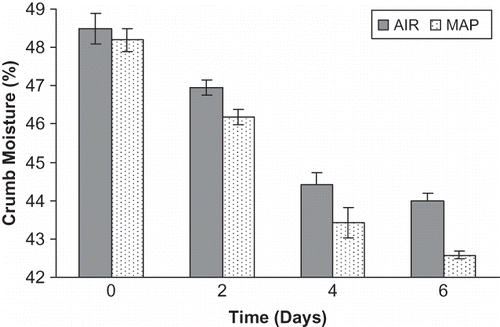
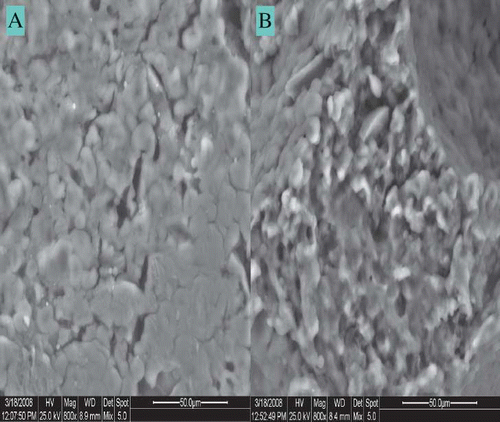
Figure 6 Scanning electron micrograms (800×) of the crumb of gluten free bread. (a) Control –non HPMC; and (b) optimized with HPMC.