Figures & data
Figure 1 Extruder screw configuration and barrel temperature profile.
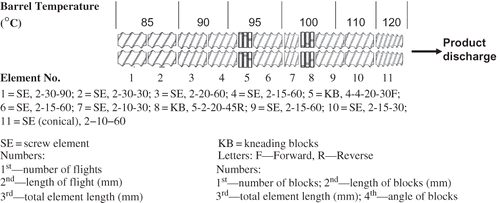
Table 1 Residual moisture in MLP-oat flour extrudates
Figure 2 Sectional expansion index (SEI) of MLP-oat flour extrudates processed at various levels of in-barrel moisture (w.b.). Error bars represent standard deviation.
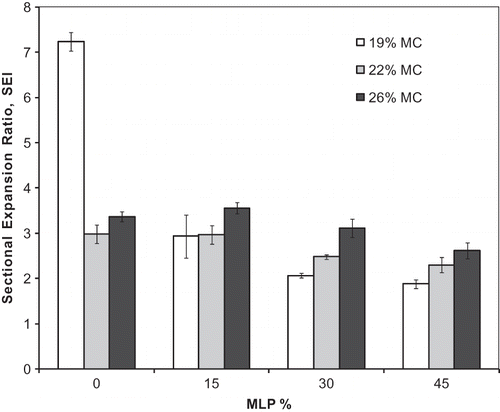
Figure 3 A typical force-deformation curve for MLP-oat flour extrudates (color figure available online).
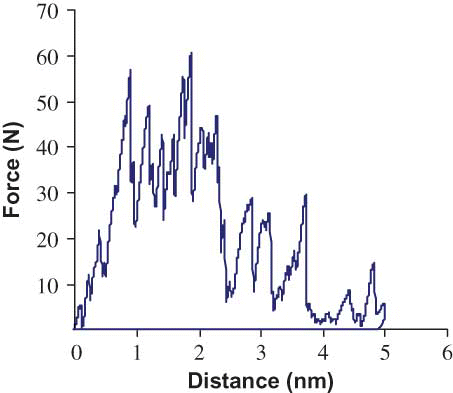
Figure 4 Crispness work (Wc ) data for MLP-oat flour extrudates processed at various levels of in-barrel moisture (w.b.). Error bars represent standard deviation.
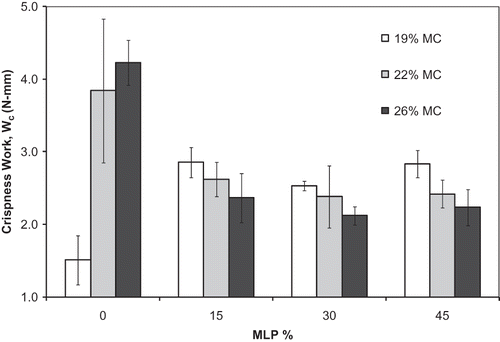
Figure 5 Phase transition analyzer data for unprocessed blends with 0–45% MLP at various moisture contents (w.b.)—(a) softening temperature (Ts ) and (b) flow temperature (Tf ). Error bars represent standard deviation (color figure available online).
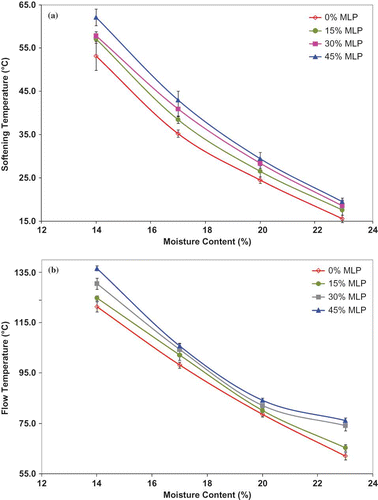
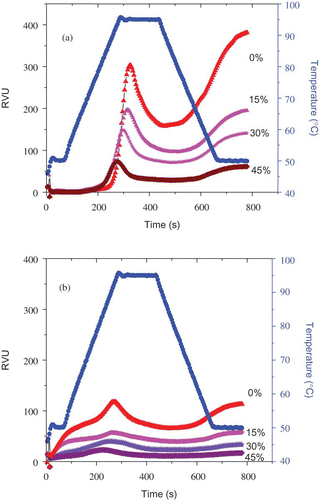
Figure 6 RVA temperature profile and pasting curves for blends with 0–45% MLP before (a) and after (b) extrusion (color figure available online).