Figures & data
Table 1 Fatty acid composition of FFS and OFS oils.Footnote*
Figure 1 Ultraviolet/visible spectra of the FFS and OFS oils. Figure derived from scans (λ = 200–290) of oil diluted 1:800; from scans (λ = 290–400) of oil diluted 1:100; and from scans (λ = 400–800) of oil diluted 1:10, all in hexane.
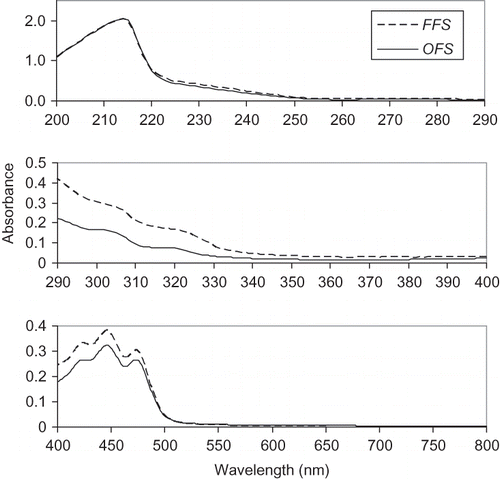
Table 2 Physicochemical characteristics of FFS and OFS oils.Footnote*
Figure 2 Thermogravimetric curves and corresponding derivative curves of the FFS and OFS oils. The inset shows the detailed section of the thermogravimetric curves at temperatures between 120 and 240°C (color figure available online).
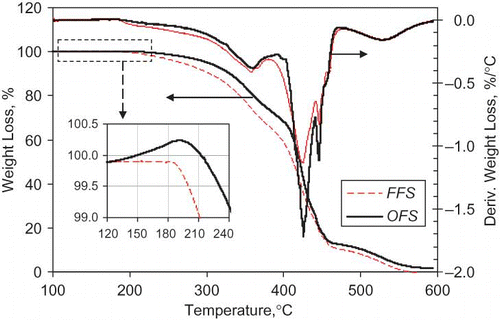
Figure 3 Melting thermograms for the FFS and OFS oils.
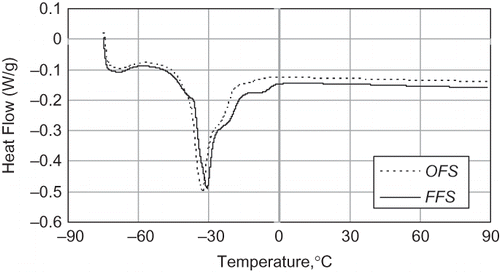
Figure 4 The apparent viscosities of the FFS and OFS oils at various temperatures. The symbols represent the measured values and the solid lines represent the predicted values using EquationEq. (3).
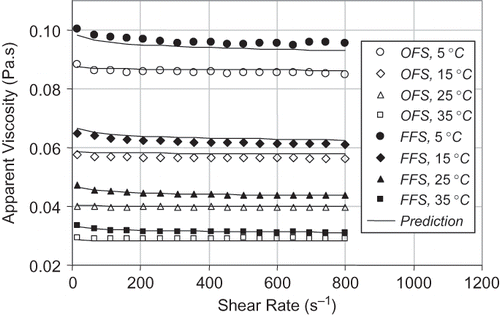
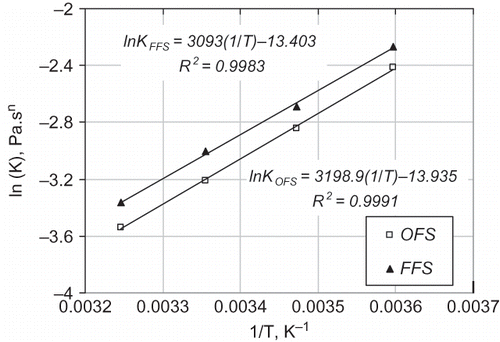
Figure 5 Arrhenius plots (ln (K) against (1/T)) for the FFS and OFS oils.