Figures & data
Figure 1 Different varieties of sweet potato tubers used in the study: (a) 362-7; (b) CO3-4; (c) SI 60; (d) Sree Arun; (e) SV 280; (f) SV 98; (g) Sree Varun. (Color figure available online.)

Table 1 Textural properties of sweet potato raw tubers
Table 2 Biochemical properties of sweet potato tubers
Table 3 Texture profile parameters of cooked tubers
Table 4 Values of constants in linear model relating degree of cooking and relative firmness of sweet potato tubersFootnote**
Figure 2 Comparison of the observed and predicted values of degree of cooking by the linear regression equations.
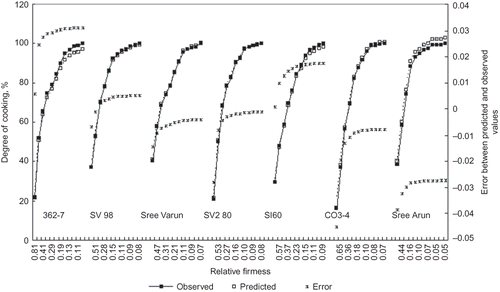
Figure 3 Comparison of the observed and predicted values of the kinetic models for the thermal softening of sweet potato tubers.
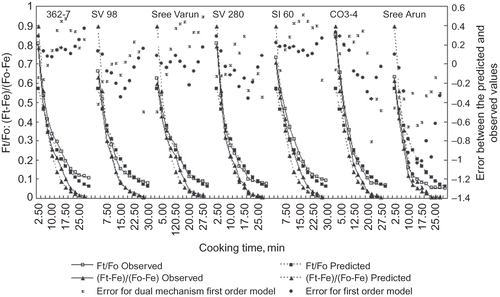
Table 5 Values of constants in the first order and dual mechanism first order kinetic model to explain thermal softening of sweet potato tubers
Figure 4 Viscometric properties of flours extracted from sweet potato tubers of different varieties. Columns with the same letters for each property are not significantly different (p < 0.05) by Duncan's multiple range test. The vertical line on each column/point represents error bars using standard deviation.
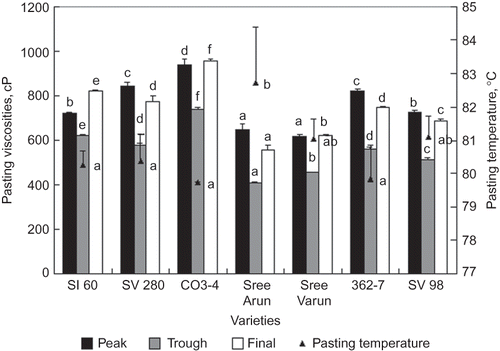
Figure 5 Gelatinization properties of sweet potato flours from different varieties. Columns with the same letters for each property are not significantly different (p < 0.05) by Duncan's multiple range test. The vertical line on each column/point represents error bars using standard deviation.
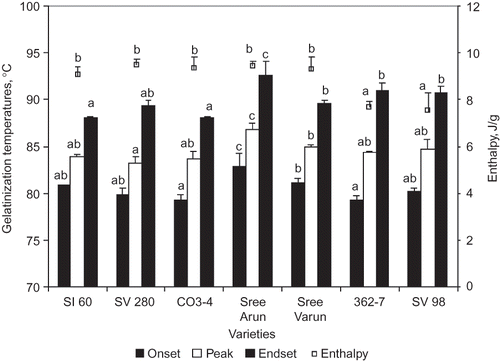
Figure 6 Dendrogram based on the textural attributes of raw sweet potato tubers.
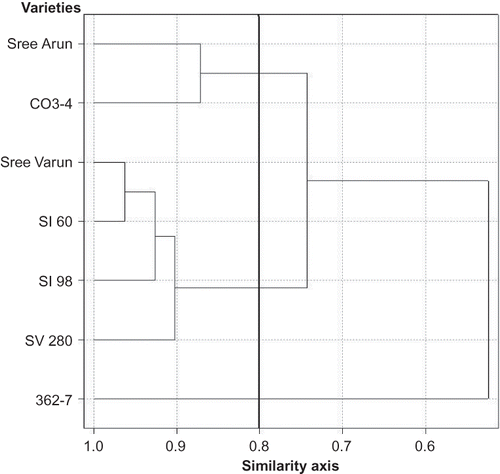
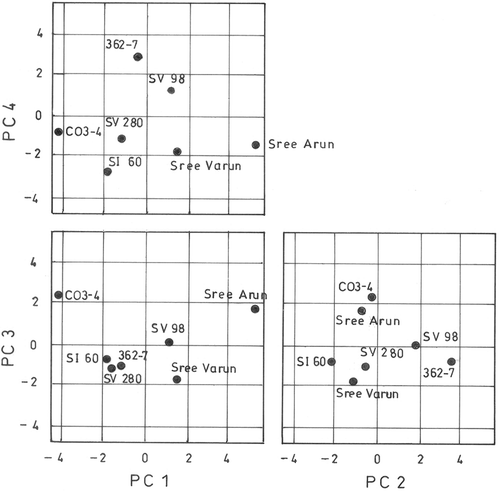
Figure 7 Score plot of sweet potato varieties based on texture profile of cooked tubers and pasting and gelatinization properties of flour.