Figures & data
Figure 1 Apparent viscosity (η), pH, and acidity changes during milk fermentation. □, pH control; ▪, pH ropy; △, η control; ▴, η ropy; ◯, acidity control; •, acidity ropy.
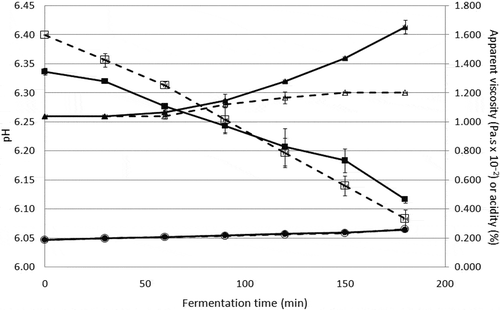
Table 1 Cheese yield
Table 2 Chemical composition of the cheese (g·100 g−1)
Figure 2 Weight variation in cheese during ripening. □, control; ▪, ropy.
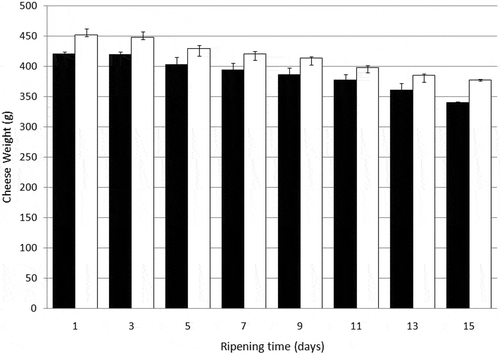
Figure 3 Microstructure (×5000) of three different sections of control Mexican manchego-type cheese: (A) rind, (B) medium, and (C) centre. The scale bar indicates 5 μm.
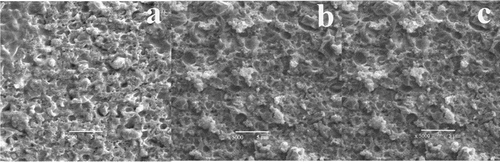
Figure 4 Microstructure (×5000) of three different sections of ropy Mexican manchego-type cheese: (A) rind, (B) medium, and (C) centre. The scale bar indicates 5 μm.
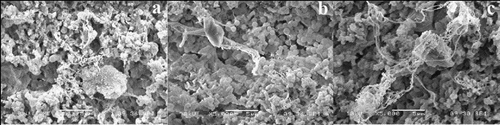
Table 3 Textural characteristics of ropy and control cheese
Figure 5 TPA curves obtained for the two kinds of cheese. - - - Control, — ropy.
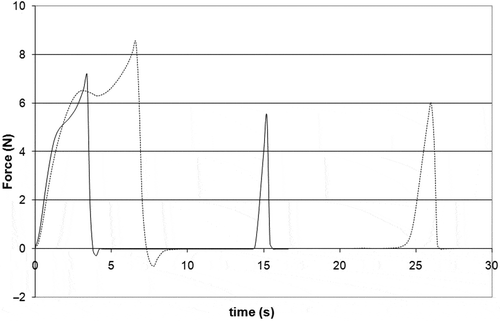
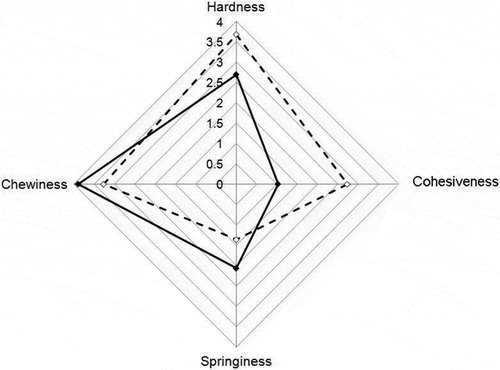
Figure 6 Comparison of the sensory attributes of ropy and control Mexican manchego-type cheese. □, control; ▪, ropy.