1,118
Views
13
CrossRef citations to date
0
Altmetric
Original Articles

Antioxidant and Anti-Inflammatory Properties of Lower-Polymerized Polyphenols in Oolong Tea

, , &
Pages 752-764 | Received 31 Dec 2011, Accepted 09 Mar 2012, Published online: 21 Nov 2013

Figures & data

Table 1  Contents of total phenolics, total flavonoids, condensed tannin, and proanthocyanidins in oolong tea filtrates and fractionated tea extracts

Table 2  Contents of gallic acid, caffeic acid, epicatechins (EC), and (-)-epigallocatechin gallate (ECGC) in TMT, MMT, and HMT

Table 3  2,2-diphenyl-1-picryhydrazyl- (DPPH-) radical-scavenging activity and antioxidant capacity of EGCG, OT, and FT

Figure 1 NO scavenging ability (a) and reducing power (b) of EGCG and the tea extracts. Each data point represents the mean ± SD of four independent experiments. For each data point, the means with different letters or symbol are significantly different from each other at p < 0.05.
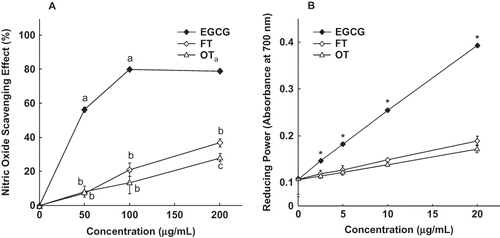
Figure 1 NO scavenging ability (a) and reducing power (b) of EGCG and the tea extracts. Each data point represents the mean ± SD of four independent experiments. For each data point, the means with different letters or symbol are significantly different from each other at p < 0.05.

Figure 2 Effect of EGCG and the tea extracts on NO production (a) and prostaglandin E2 (PGE2) synthesis (b) in lipopolysaccharide- (LPS-) activated RAW264.7 cells. Adherent RAW264.7 cells were incubated with medium containing LPS (0.1 μg/mL) alone (control), or with LPS and tea extract (500 μg/mL) or EGCG (100 μg/mL) for 16 h. Each lane represents the mean ± SD of three independent experiments. In each category, the means with different letters are significantly different from each other at p < 0.05.

Figure 2 Effect of EGCG and the tea extracts on NO production (a) and prostaglandin E2 (PGE2) synthesis (b) in lipopolysaccharide- (LPS-) activated RAW264.7 cells. Adherent RAW264.7 cells were incubated with medium containing LPS (0.1 μg/mL) alone (control), or with LPS and tea extract (500 μg/mL) or EGCG (100 μg/mL) for 16 h. Each lane represents the mean ± SD of three independent experiments. In each category, the means with different letters are significantly different from each other at p < 0.05.

Figure 3 Effect of EGCG and tea extracts on the expression of iNOS, and COX-2 in RAW264.7 cells (a). The relative density of the bands, which were assessed after Western blotting (b and c). Adherent RAW264.7 cells were incubated with medium containing LPS (0.1 μg/mL) alone (control), or with LPS and tea extract (500 μg/mL) or EGCG (100 μg/mL) for 16 h. The induction of NO synthase and cyclooxygenase-2 expression was determined by Western blotting. α-tubulin was used as a loading control. Each value represents the mean ± SD of three independent experiments. The values with different letters are significantly different from each other at p < 0.05. (Color figure available online.)

Figure 3 Effect of EGCG and tea extracts on the expression of iNOS, and COX-2 in RAW264.7 cells (a). The relative density of the bands, which were assessed after Western blotting (b and c). Adherent RAW264.7 cells were incubated with medium containing LPS (0.1 μg/mL) alone (control), or with LPS and tea extract (500 μg/mL) or EGCG (100 μg/mL) for 16 h. The induction of NO synthase and cyclooxygenase-2 expression was determined by Western blotting. α-tubulin was used as a loading control. Each value represents the mean ± SD of three independent experiments. The values with different letters are significantly different from each other at p < 0.05. (Color figure available online.)

Figure 4 Effect of EGCG and tea extracts on the level of AA. RAW264.7 cells were incubated with only medium or medium containing EGCG (20 μg/mL) or tea extracts (400 μg/mL) for 16 h. Each value represents the mean ± SD of three independent experiments. The values with different letters are significantly different from each other at p < 0.05.

Figure 4 Effect of EGCG and tea extracts on the level of AA. RAW264.7 cells were incubated with only medium or medium containing EGCG (20 μg/mL) or tea extracts (400 μg/mL) for 16 h. Each value represents the mean ± SD of three independent experiments. The values with different letters are significantly different from each other at p < 0.05.

Reprints and Corporate Permissions

Please note: Selecting permissions does not provide access to the full text of the article, please see our help page How do I view content?

To request a reprint or corporate permissions for this article, please click on the relevant link below:

Academic Permissions

Please note: Selecting permissions does not provide access to the full text of the article, please see our help page How do I view content?

Obtain permissions instantly via Rightslink by clicking on the button below:

If you are unable to obtain permissions via Rightslink, please complete and submit this Permissions form. For more information, please visit our Permissions help page.